概述
我撰写上一篇文章的目的是创建一个方便的工具包,允许使用键盘快捷键在图表上快速绘制直线。 第一篇文章里包括一段视频,演示了现成解决方案的工作原理。
当前的实现中未提供 GUI(尽管其已在未来计划中)。 该程序简单地根据键盘快捷键绘制直线。 它加快了访问诸如更改当前图表“层次”(Z-索引),切换时间帧和切换直线绘制模式(射线/线段)之类的操作速度。
鼠标位置判断对象应绘制的位置。 如果鼠标指针位于价格上方,则选烛条高点作为基点。 如果鼠标指针位于价格下方,则选低点。
当前函数库版本可以绘制以下对象:
- 简单 ("无终点")直线 — 水平和垂直线。
- 常规趋势线 (最接近鼠标的两个极值点)。 您可以将线条设置为线段或射线。 如果该线是线段,则可用特殊模式将线段的终点设置到未来的一点。 在这种情况下,该线大小等于两个极值点之间的距离乘以某个系数,该系数可在 EA 参数中指定。
- 水平级别具有一定长度的 (非无终点)。 该工具箱可以绘制短线和“延伸”线,您可以为其指定相对于短线的比率。
- 一条带有水平标签的垂线。
- 斐波那契扇形。 级别参数是可配置的,但我用的是经过稍微修改的版本,该版本曾经由绰号为 Vadimcha 的男子在 “Onyx” 上展示。 他们称这个扇形为 VFan,即我在代码中继续采用的名字。
- 安德鲁草叉一套由三个对象组成。
项目结构非常简单。 该函数库有五个相关文件:“ GlobalVariables.mqh”,“ Graphics.mqh”,“ Mouse.mqh”,“ Shortcuts.mqh”,“ Utilites.mqh ”。 所有文件都位于标准 Include 目录中的一个 Shortcuts 文件夹当中。
主文件是 “Shortcuts.mqh”,与所有其他文件连接。 在该文件中创建了 CShortcuts 类的实例,从而令该函数库可以轻松地与您的主要智能交易系统连接。
在前一篇文章中,我曾重点介绍了帮助文件 “Utilites.mqh”。 在本文中,我们将主要处理包含绘图逻辑的 “Graphics.mqh” 文件。
全局设置文件
第二个函数库版本提供了丰富的扩展配置选项,因为它含有更多会受到影响的对象。 当前版本的完整代码如下:
//+------------------------------------------------------------------+
//|                                              GlobalVariables.mqh |
//|                        Copyright 2020, MetaQuotes Software Corp. |
//|                            https://www.mql5.com/en/articles/7908 |
//+------------------------------------------------------------------+
#property copyright "Copyright 2020, MetaQuotes Software Corp."
#property link      "https://www.mql5.com/en/articles/7908"
//+------------------------------------------------------------------+
//| File describing parameters available to the user                 |
//+------------------------------------------------------------------+
#define VERSION 2.0 // Not #property but a constant. A bit more convenient.
//+------------------------------------------------------------------+
//| Key settings                                                     |
//+------------------------------------------------------------------+
input string   Keys="=== Key settings ===";
input string   Up_Key="U";                          // Switch timeframe up
input string   Down_Key="D";                        // Switch timeframe down
input string   Trend_Line_Key="T";                  // Trend line
input string   Switch_Trend_Ray_Key="R";            // Indication of a trend line ray
input string   Z_Index_Key="Z";                     // Indication of the chart on top
input string   Vertical_With_Short_Levels_Key="V";  // Vertical segment
input string   Short_Level_Key="S";                 // Short level
input string   Long_Level_Key="L";                  // Extended level
input string   Simple_Horizontal_Line_Key="H";      // Simple horizontal line
input string   Simple_Vertical_Line_Key="I";        // Simple vertical line
input string   VFun_Key="F";                        // Fibonacci fan
input string   Pitchfork_Key="P";                   // Andrews' pitchfork

//+------------------------------------------------------------------+
//| Color setting                                                    |
//+------------------------------------------------------------------+
input string   Colors="=== Color Settings ===";
input color    VFan_Color=clrLightGray;            // Color of the fan lines
                                                   //   (and an additional
                                                   //    one for special cases)
//---
input color    Pitchfork_Main_Color = clrBlue;     // Andrews' pitchfork color
input color    Pitchfork_Shiff_Color = clrRed;     // Schiff pitchfork color
input color    Pitchfork_Reverce_Color = clrYellow;// "Reverse" pitchfork color

//+------------------------------------------------------------------+
//| Size settings                                                    |
//+------------------------------------------------------------------+
input string   Dimensions="=== Size settings ===";
input int      Short_Level_Length=12;     // Short level length (bar)
input int      Short_Level_Width=1;       // Line width for the short level
input int      Long_Level_Width=2;        // Line width for the long level
input int      Vertical_With_Short_Levels_Width=1; // Vertical line width with levels
input int      Short_Level_7_8_Width=1;   // Level 7/8 line width
input int      Short_Level_14_8_Width=1;  // Level 14/8 line width
input int      Simple_Vertical_Width=1;   // Simple vertical line width
input int      Simple_Horizontal_Width=1; // Simple horizontal line width
input int      Trend_Line_Width=2;        // Trend line width

//+------------------------------------------------------------------+
//| Display styles                                                   |
//+------------------------------------------------------------------+
input string   Styles="=== Display styles ===";
input ENUM_LINE_STYLE      Vertical_With_Short_Levels_Style=STYLE_SOLID; // Vertical Line style
                                                                         // with levels
input ENUM_LINE_STYLE      Short_Level_Style=STYLE_SOLID;      // Short Level style
input ENUM_LINE_STYLE      Long_Level_Style=STYLE_SOLID;       // Long level style
input ENUM_LINE_STYLE      Short_Level_7_8_Style=STYLE_SOLID;  // Level 7/8 style
input ENUM_LINE_STYLE      Short_Level_14_8_Style=STYLE_DOT;   // Level 14/8 style
input ENUM_LINE_STYLE      Simple_Vertical_Style=STYLE_DOT;    // Simple Vertical style
input ENUM_LINE_STYLE      Simple_Horizontal_Style=STYLE_DOT;  // Simple Horizontal style
input ENUM_LINE_STYLE      VFun_Levels_Style=STYLE_SOLID;      // Fan Style
input ENUM_LINE_STYLE      Trend_Line_Style=STYLE_SOLID;       // Trend line style
//---
input ENUM_LINE_STYLE      Pitchfork_Main_Style = STYLE_SOLID;    // Andrews' Pitchfork style
input ENUM_LINE_STYLE      Pitchfork_Shiff_Style = STYLE_SOLID;   // Schiff Pitchfork style
input ENUM_LINE_STYLE      Pitchfork_Reverce_Style = STYLE_SOLID; // Reverse Pitchfork style
//+------------------------------------------------------------------+
//| Pitchfork extrema parameters                                     |
//+------------------------------------------------------------------+
input string               Pitchforks="=== Pitchfork Extrema Parameters ===";
//---
input int                  Pitchfork_First_Point_Left_Bars=6;   // Pitchfork - 1st point, bars on the left
input int                  Pitchfork_First_Point_Right_Bars=6;  // Pitchfork - 1st point, bars on the left
//---
input int                  Pitchfork_Second_Point_Left_Bars=6;  // Pitchfork - 2nd point, bars on the left
input int                  Pitchfork_Second_Point_Right_Bars=6; // Pitchfork - 2nd point, bars on the right
//---
input int                  Pitchfork_Third_Point_Left_Bars=6;   // Pitchfork - 3rd point, bars on the left
input int                  Pitchfork_Third_Point_Right_Bars=2;  // Pitchfork - 3rd point, bars on the right
//+------------------------------------------------------------------+
//| Other parameters                                                 |
//+------------------------------------------------------------------+
input string               Others="=== Other Parameters ===";
input double               Vertical_Short_Level_Coefficient=0.825;  // Coefficient of vertical levels
input double               Long_Level_Multiplicator=2;              // Multiplier for the long level
input int                  Trend_Length_Coefficient=4;              // Coefficient for the trend line length
input bool                 Is_Trend_Ray=false;                      // Trend line - ray
input bool                 Is_Change_Timeframe_On_Create = true;    // Hide objects on higher timeframes?
                                                                    //   (true - hide, false - show)
input bool                 Is_Select_On_Create=true;                // Select upon creation
input bool                 Is_Different_Colors=true;                // Change colors for times

// Number of bars on the left and on the right
// for trend line and fan extreme points
input int                  Fractal_Size_Left=1;                     // Size of the left fractal
input int                  Fractal_Size_Right=1;                    // Size of the right fractal

input bool                 Pitchfork_Show_Main = true;     // Display Andrews' pitchfork
input bool                 Pitchfork_Show_Shiff = true;    // Display Schiff pitchfork
input bool                 Pitchfork_Show_Reverce = true;  // Display "Reverse" pitchfork
input bool                 Print_Warning_Messages=true;    // Display error messages
input string               VFun_Levels="-1.5,-0.618,-0.236,"+
                                       "  0,0.236,0.382,"+
                                       "  0.618,0.786,0.886,0.942";  // Fan levels
input string               Array_Delimiter=",";            // Array elements separator
//---

//+------------------------------------------------------------------+
//| Name prefixes of drawn shapes (can be change only in code,       |
//| not visible in EA parameters)                                    |
//+------------------------------------------------------------------+
//string   Prefixes="=== Prefixes ===";
//string   Vertical_With_Short_Levels_Prefix="Vertical_";  // Prefix for vertical lines with levels
//string   Short_Level_Prefix="Short_Level_";              // Prefix for short levels
//string   Long_Level_Prefix="Long_Level_";                // Prefix for long levels
//string   Simple_Horizontal_Prefix="Simple_H_";           // Prefix for simple horizontal lines
//string   Simple_Vertical_Prefix="Simple_V_";             // Prefix for simple vertical lines
//string   VFan_Prefix="VFan_";                            // Prefix for fan
//string   Trend_Line_Prefix="Trend_";                     // Prefix for trend lines
//string   Pitchfork_Prefix="Pitchfork_";                  // Prefix for pitchfork
string   allPrefixes[] =      // Prefixes for object names
  {
   "Trend_",            // 0 - Prefix for trend lines
   "Simple_H_",         // 1 - Prefix for simple horizontal lines
   "Simple_V_",         // 2 - Prefix for simple vertical lines
   "VFan_",             // 3 - Prefix for fan
   "Pitchfork_",        // 4 - Prefix for pitchfork
   "Vertical_",         // 5 - Prefix for vertical lines with levels
   "Short_Level_",      // 6 - Prefix for short levels
   "Long_Level_"        // 7 - Prefix for long levels
  };

//+------------------------------------------------------------------+
//| Colors for objects of one timeframe (can be changed only in code,|
//| not visible in EA parameters)                                    |
//+------------------------------------------------------------------+
// string TimeframeColors="=== Standard Colors for Timeframes  ===";
color mn1_color=clrCrimson;
color w1_color=clrDarkOrange;
color d1_color=clrGoldenrod;
color h4_color=clrLimeGreen;
color h1_color=clrLime;
color m30_color=clrDeepSkyBlue;
color m15_color=clrBlue;
color m5_color=clrViolet;
color m1_color=clrDarkViolet;
color common_color=clrGray;

//--- Auxiliary constant for displaying error messages
#define DEBUG_MESSAGE_PREFIX "=== ",__FUNCTION__," === "

//--- Constants for describing the main timeframes when drawing
//--- For compatibility with version 4, timeframes that do not exist
//---    in the toolbar are excluded.
#define PERIOD_LOWER_M5 OBJ_PERIOD_M1|OBJ_PERIOD_M5
#define PERIOD_LOWER_M15 PERIOD_LOWER_M5|OBJ_PERIOD_M15
#define PERIOD_LOWER_M30 PERIOD_LOWER_M15|OBJ_PERIOD_M30
#define PERIOD_LOWER_H1 PERIOD_LOWER_M30|OBJ_PERIOD_H1
#define PERIOD_LOWER_H4 PERIOD_LOWER_H1|OBJ_PERIOD_H4
#define PERIOD_LOWER_D1 PERIOD_LOWER_H4|OBJ_PERIOD_D1
#define PERIOD_LOWER_W1 PERIOD_LOWER_D1|OBJ_PERIOD_W1
//+------------------------------------------------------------------+
与以前版本相比所有新添加的内容均以黄色高亮显示。 这些新功能不仅可以配置直线,还可以配置屏幕上显示的其他对象。
我将对象前缀的名称放入数组中,以便以后使用它们时会更方便。 例如,我计划添加一个删除复杂对象的功能(譬如说,带有级别的垂直线)。 针对这种情况下,该数组将更加方便。
现在我们已研究过设置,可以继续进行图形处理了。
绘制“基元”:垂直和水平线
也许您要创建的第一个对象是水平线和时间线(无限的水平和垂直线)。 实际上,函数库就是从这些直线开始的。
此为代码:
//+------------------------------------------------------------------+
//| Draws simple straight lines (vertical and horizontal) in the     |
//| position specified by mouse or parameters                        |
//| Parameters:                                                      |
//|   _object_type - object type. Can be OBJ_VLINE or OBJ_HLINE      |
//|   _time - time.  If not specified, mouse time is used            |
//|   _price - price. If not specified, price under index is used.   |
//+------------------------------------------------------------------+
void              CGraphics::DrawSimple(
   ENUM_OBJECT _object_type, // Object type
   datetime    _time=-1,     // Time
   double      _price=-1     // Price
)
  {
//---
   string Current_Object_Name;   // The name of the future object
   color Current_Object_Color=   // Color (depends on the "standard" color of the timeframe)
      CUtilites::GetTimeFrameColor(CUtilites::GetAllLowerTimeframes());
   datetime Current_Object_Time; // Starting point time
   double Current_Object_Price;  // Starting point price
   ENUM_LINE_STYLE Current_Object_Style=STYLE_DOT; // Line style
   int Current_Object_Width=1;   // Line width
   int window=0;                 // Subwindow number

//--- Set up line parameters depending on the type
   if(_object_type==OBJ_VLINE)   // For vertical lines
     {
      Current_Object_Name=       // Generate the name
         CUtilites::GetCurrentObjectName(
            Simple_Vertical_Prefix,
            _object_type
         );
      // style - according to global parameters
      Current_Object_Style=Simple_Vertical_Style;
      // width - according to global parameters
      Current_Object_Width=Simple_Vertical_Width;
     }
   else
      if(_object_type==OBJ_HLINE)// For horizontal lines
        {
         Current_Object_Name=    // Generate the name
            CUtilites::GetCurrentObjectName(
               Simple_Horizontal_Prefix,
               _object_type
            );
         // style - according to global parameters
         Current_Object_Style=Simple_Horizontal_Style;
         // width - according to global parameters
         Current_Object_Width=Simple_Horizontal_Width;
        }
      else  // This function only draws horizontal and vertical lines.
        {
         // If something else is passed in parameters...
         if(Print_Warning_Messages)
           {
            // ...report an error...
            Print(DEBUG_MESSAGE_PREFIX,"Error, wrong object type");
           }
         // ...and exit.
         return;
        }

//--- If coordinates are not specified in the parameters, use the coordinates of the mouse
   Current_Object_Price = _price==-1 ? CMouse::Price() : _price;
   Current_Object_Time = _time==-1 ? CMouse::Time() : _time;

//--- Create the object
   ObjectCreate(
      0,
      Current_Object_Name,
      _object_type,
      0,
      Current_Object_Time,
      Current_Object_Price
   );

//--- Set display parameters for the created object
   CurrentObjectDecorate(
      Current_Object_Name,
      Current_Object_Color,
      Current_Object_Width,
      Current_Object_Style
   );

//--- Redraw the chart and complete
   ChartRedraw(0);
  }
操作非常简单。 生成名称,从 “GlobalVariables.mqh” 文件中定义的输入变量获取设置,获取对象起始点的坐标(即可来自函数参数,亦或简单地取用鼠标的坐标),对象就准备好了。
这就是所有了!
现在我们需要将此函数添加到文件头文件里
//+------------------------------------------------------------------+
//|                                                     Graphics.mqh |
//|                        Copyright 2020, MetaQuotes Software Corp. |
//|                            https://www.mql5.com/es/articles/7468 |
//+------------------------------------------------------------------+

// ...

//+------------------------------------------------------------------+
//| Class for plotting graphic objects                               |
//+------------------------------------------------------------------+
class CGraphics
  {

   // ...

public:

   // ...

   //--- Draws simple straight lines (vertical and horizontal)
   void              CGraphics::DrawSimple(
      ENUM_OBJECT _object_type, // Object type
      datetime    _time=-1,     // Time
      double      _price=-1     // Price
   )

   // ...
  }
;
//+------------------------------------------------------------------+
还有,为相应的按键添加处理:
//+------------------------------------------------------------------+
//|                                                    Shortcuts.mqh |
//+------------------------------------------------------------------+

// ...

//+------------------------------------------------------------------+
//| Event handling function                                          |
//+------------------------------------------------------------------+
void CShortcuts::OnChartEvent(
   const int id,
   const long &lparam,
   const double &dparam,
   const string &sparam
)
  {
//---
   int window = 0;
//---
   switch(id)
     {

      // ...

      //--- Handle keystrokes
      case CHARTEVENT_KEYDOWN:

         // ...

         //--- Draw a simple vertical line
         if(CUtilites::GetCurrentOperationChar(Simple_Vertical_Line_Key) == lparam)
           {
            m_graphics.DrawSimple(OBJ_VLINE);
           }
         //--- Draw a simple horizontal line
         if(CUtilites::GetCurrentOperationChar(Simple_Horizontal_Line_Key) == lparam)
           {
            m_graphics.DrawSimple(OBJ_HLINE);
           }

         // ...

         break;
         //---

     }
  }
在将来,为了节省屏幕空间,并专注于主要思想,在添加函数说明时,我不再编写头部注释,而是显示新添加命令的相应行(黄色高亮)。
所有添加和编译的结果非常简单:两个命令可在当前窗口的任何位置绘制图形基元:

这些直线的默认快捷键是 "I" (i) 和 "H" (h)。
不要忘记,所创建对象的颜色会有所不同,具体取决于当前时间帧。 来自较低时间帧的对象不会在较高时间帧里显示(默认设置)。


为了兼容 MQL4,我们仅采用来自标准工具栏的时间帧,作为默认显示。 选择这些时间帧时,您可用 "U" 和 "D" 键 (按这些键可向上或向下更改一次图表周期的时间帧;参见 CUtilites::ChangeTimeframes 函数)。
VFun, 或斐波那契扇形
下一个形状是斐波那契扇形。 我经常这样用它。 但每次都要用不同的终端来记住所有射线是非常不便的。 因此,我决定将此工具添加到精彩的 EA 当中。
我已进一步发展了这一思路,并决定为使用该函数库绘制的任何对象实现一个通用的设置斐波那契级别的函数(扇形通道或水平斐波级别)。 此为该函数。
//+------------------------------------------------------------------+
//| Sets level values and form in any Fibonacci object               |
//|    Uses colors and styles from the class fields                  |
//| Parameters:                                                      |
//|    _object_name - the name of the Fibonacci object               |
//|    _levels_values[] - array of level values                      |
//+------------------------------------------------------------------+
void CGraphics::SetFiboLevels(
   string _object_name,                      // Object name
   const double &_levels_values[]            // Array of values
)
  {
   int i,                                      // Current level counter
       levels_count=ArraySize(_levels_values); // Total number of levels

//--- Check if the number of values in the array exceeds the allowed range
   if(levels_count>32 || levels_count==0)
     {
      Print(DEBUG_MESSAGE_PREFIX,": Levels cannot be set! Data array is incorrectly. ");
      return;
     }

//--- Proceed with the implementation

//--- Set the number of levels for the current object
   ObjectSetInteger(0,_object_name,OBJPROP_LEVELS,levels_count);
//--- Set value, color and style for each level.
   for(i=0; i<levels_count; i++)
     {
      ObjectSetDouble(0,_object_name,OBJPROP_LEVELVALUE,i,_levels_values[i]);
      ObjectSetInteger(0,_object_name,OBJPROP_LEVELCOLOR,i,m_Fibo_Default_Color);
      ObjectSetInteger(0,_object_name,OBJPROP_LEVELSTYLE,i,m_Fibo_Default_Style);
     }
//--- Redraw the chart before finishing
   ChartRedraw(0);
  }
传递给函数的参数包括为其设置级别的对象名称,以及所有级别值的数组。
首先,该函数检查所传递的级别数量。 如果数组太大,则该函数会假定已发生错误,且不执行任何操作。 如果数组中没有元素,它也会退出。
那么,若一切正常,且数组中的元素数量未超出允许的范围,那么我们开始添加级别。 对象的名称是在参数中指定的,因此我们只需将对象的相应属性设置为等于数组元素的数量,并在设置相应级别的同时遍历整个数组。
MQL5 还允许为不同的参数设置不同的级别。 例如,我们可以设置不同的颜色。 我们也可以使用不同的样式(实线、虚线、等等)。 MQL4 则未提供此类选项。 尽管如此,我还在循环中添加了定义直线颜色和样式。它们在编译时不会影响 MQL5 的通用性。
变量说明的默认参数被定义为 CGraphics 类的私有成员,并在类构造函数中以 EA 参数中的数值进行初始化。
//+------------------------------------------------------------------+
//|                                                     Graphics.mqh |
//+------------------------------------------------------------------+
//+------------------------------------------------------------------+
//| Class for plotting graphic objects                               |
//+------------------------------------------------------------------+
class CGraphics
  {
   //--- Fields
private:
   // ...
   color             m_Fibo_Default_Color;
   ENUM_LINE_STYLE   m_Fibo_Default_Style;
   // ...
//+------------------------------------------------------------------+
//| Default constructor                                              |
//+------------------------------------------------------------------+
CGraphics::CGraphics(void)
  {
   //...
   m_Fibo_Default_Color = Fibo_Default_Color;
   m_Fibo_Default_Style = VFun_Levels_Style;
  }
   // ...
对于那些不关心兼容性的人,我还添加了该函数的一个覆盖。 它允许采用函数参数中所传递的数组为每个级别设置参数。 我想代码中的内容都很清楚。 如果您需要进一步的解说,请留下相应的评论。 在附带的 zip 中启用了函数覆盖。
此处是另一个函数,可为任何斐波那契对象设置级别描述。
//+------------------------------------------------------------------+
//| Sets descriptions of levels in any Fibonacci object              |
//|    _object_name - the name of the Fibonacci object               |
//|    _levels_descriptions[] - array of level descriptions          |
//+------------------------------------------------------------------+
void CGraphics::SetFiboDescriptions(
   string _object_name,                  // Object name
   const string &_levels_descriptions[]  // Array of descriptions
)
  {
   int i,                                                                  // Current level counter
       levels_count=(int)ObjectGetInteger(0,_object_name,OBJPROP_LEVELS),  // The real number of levels
       array_size=ArraySize(_levels_descriptions);                         // The number of received descriptions
//--- Loop  through all levels
   for(i=0; i<levels_count; i++)
     {
      if(array_size>0 && i<array_size) // Choose a description from the array
        {
         //--- and write it to the level
         ObjectSetString(0,_object_name,OBJPROP_LEVELTEXT,i,_levels_descriptions[i]);
        }
      else // If the descriptions are not enough,
        {
         ObjectSetString(0,_object_name,OBJPROP_LEVELTEXT,i,""); // leave the description empty
        }
     }
//--- Redraw the chart before finishing
   ChartRedraw(0);
  }
这里没什么复杂的。 唯一的条件是,在调用此函数时,必须已经设置了对象级别。 该函数只是简单地遍历这些级别,并将来自数组的相应值分配给每个级别的描述。 如果数组中的数据不足,某些级别将保持不变,且无需说明。
现在,在添加级别时变得更容易了,我们可以编写添加斐波那契扇形的函数。
//+------------------------------------------------------------------+
//| Draws a Fibonacci fan from the nearest local extremum.           |
//+------------------------------------------------------------------+
void CGraphics::DrawVFan(void)
  {
//---
   double levels_values[];                 // Array of level values
   string levels_descriptions[] = {};      // Array of level descriptions
   int p1=0,                               // Bar number for the fan starting point
       p2=0;                               // Bar number for the fan ending point
   double price1=0,                        // First point price
          price2=0;                        // Second point price
   string fun_name =                       // Fan name
      CUtilites::GetCurrentObjectName(allPrefixes[3],OBJ_FIBOFAN),
      fun_0_name =
         CUtilites::GetCurrentObjectName(allPrefixes[3]+"0_",OBJ_TREND);

//--- Get data for the fan from the parameter string
   CUtilites::StringToDoubleArray(VFun_Levels,levels_values);

//--- Find the extreme points closest to the mouse
   if(CMouse::Below())     // If the mouse cursor is below the price
     {
      CUtilites::SetExtremumsBarsNumbers(false,p1,p2);
      price1=iLow(Symbol(),PERIOD_CURRENT,p1);
      price2=iLow(Symbol(),PERIOD_CURRENT,p2);
     }
   else
      if(CMouse::Above())  // If the mouse cursor is above the price
        {
         CUtilites::SetExtremumsBarsNumbers(true,p1,p2);
         price1=iHigh(Symbol(),PERIOD_CURRENT,p1);
         price2=iHigh(Symbol(),PERIOD_CURRENT,p2);
        }
//--- Create the fan object
   ObjectCreate(
      0,fun_name,OBJ_FIBOFAN,0,
      iTime(Symbol(),PERIOD_CURRENT,p1),
      price1,
      iTime(Symbol(),PERIOD_CURRENT,p2),
      price2
   );

//--- The zero ray of this object is denoted by a colored line (for compatibility with MT4)
   TrendCreate(
      0,
      fun_0_name,
      0,
      iTime(Symbol(),PERIOD_CURRENT,p1),
      price1,
      iTime(Symbol(),PERIOD_CURRENT,p2),
      price2,
      CUtilites::GetTimeFrameColor(CUtilites::GetAllLowerTimeframes()),
      0,1,false,true,true
   );

//--- Describe the fan levels
   SetFiboLevels(fun_name,levels_values);
   SetFiboDescriptions(fun_name, levels_descriptions);

//--- Set standard parameters (such as timeframes and selection after creation)
   CurrentObjectDecorate(fun_name,m_Fibo_Default_Color);
//--- Also make out the "substitute" ray
   CurrentObjectDecorate(
      fun_0_name,
      CUtilites::GetTimeFrameColor(
         CUtilites::GetAllLowerTimeframes()
      )
   );

//---
   ChartRedraw(0);
  }
我认为当形成扇形的射线具有不同的颜色时这会很方便。 为了在 MQL4 中实现此功能,我们必须像上一篇文章中那样在扇形上绘制一条常规直线。
在这种情况下,我们不需要级别标题,因此我简单地用了一个空数组。
数值数组是利用实用工具函数依据 EA 参数创建的
CUtilites::StringToDoubleArray(VFun_Levels,levels_values);
在第一篇文章中已介绍过将字符串转换为数字数组的实用程序。
将扇形绘图命令添加到命令定义列表之中:
//+------------------------------------------------------------------+
//|                                                   Shortcuts.mqhh |
//+------------------------------------------------------------------+

   //...
//--- Draw a Fibonacci fan (VFun)
         if(CUtilites::GetCurrentOperationChar(VFun_Key) == lparam)
           {
            m_graphics.DrawVFan();
           }
         break;
   //...
编译并检查结果。 打开终端并打开所需的图表。
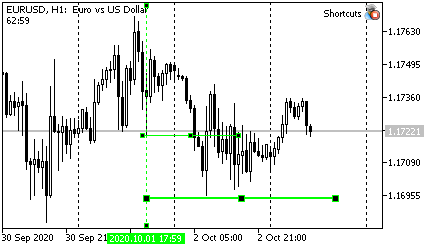
将鼠标从图表的顶部或底部移动到基准极值的左侧,然后按 “ F”。
")
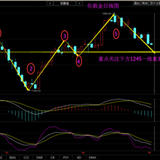
顺便说一句,查看此特定扇形的配置,我假设价格很快就会下跌。
价格最终下跌。
")
安德鲁草叉
我使用 3 类草叉。
首先,我选择所需的极值,并绘制“常规”草叉。 草叉的端点恰好处于极值价位。

安德鲁斯描述的第二类草叉是席夫草叉。 此处,端点 1 是在趋势方向上 1-2 距离的一半处。 相应地,中心线的斜率较小。 如果走势与这些草叉相适,则走势很可能是横盘,故而价格正处于“调整”走势当中。

第三类是“反转”草叉。 端点 1 是逆势方向上与 1-2 距离相同的偏移。 这种草叉可应对快速走势。 通常,它们的时间较短,但它们之间的价格差距较大。
在实际分析中,我希望同时将所有三种类型的草叉都放在图表上。 在这种情况下,价格走势以及未来可能出现的极端现象的关键点就更加清晰了。

用两个函数来绘制这样的集合。 第一个是绘制一个任意类型草叉的函数。
//+------------------------------------------------------------------+
//| Creates Andrews' pitchfork using specified coordinates            |
//| Parameters:                                                      |
//|    _name - the name of created pitchfork                         |
//|    _base - the structure containing coordinates of  basic points |
//|    _type - pitchfork type (SIMPLE,SHIFF,REVERCE)                        |
//+------------------------------------------------------------------+
void  CGraphics::MakePitchfork(
   string _name,           // The name of the created object
   PitchforkPoints &_base, // Structure describing pitchfork base points
   PitchforkType _type     // Pitchfork type (SIMPLE,SHIFF,REVERCE)
)
  {
//---
   double price_first;                 // The price of the first point (depends on the type)
   color pitchfork_color;              // Pitchfork color (depends on the type)
   int pitchfork_width;                // Line width (depends on the type)
   ENUM_LINE_STYLE pitchfork_style;    // Line style (depends on the type)
   double fibo_levels[] = {1};         // Add external levels (only for MQL5)
   string fibo_descriptions[] = {""};  // Level description (only for MQL5)

//--- Set type dependent parameters:
   if(_type == SHIFF)      // Schiff pitchfork
     {
      price_first = _base.shiffMainPointPrice;
      pitchfork_color = Pitchfork_Shiff_Color;
      pitchfork_width = Pitchfork_Shiff_Width;
      pitchfork_style = Pitchfork_Shiff_Style;
     }
   else
      if(_type == REVERCE) // "Reverse" pitchfork
        {
         price_first = _base.reverceMainPointPrice;
         pitchfork_color = Pitchfork_Reverce_Color;
         pitchfork_width = Pitchfork_Reverce_Width;
         pitchfork_style = Pitchfork_Reverce_Style;
        }
      else
        {
         // "classic" pitchfork
         price_first =_base.mainPointPrice;
         pitchfork_color = Pitchfork_Main_Color;
         pitchfork_width = Pitchfork_Main_Width;
         pitchfork_style = Pitchfork_Main_Style;
        }

//--- Draw
   ObjectCreate(0,_name,OBJ_PITCHFORK,0,
                _base.time1,price_first,
                _base.time2,_base.secondPointPrice,
                _base.time3,_base.thirdPointPrice
               );
//--- Set the parameters common for all graphical objects
   CurrentObjectDecorate(
      _name,
      pitchfork_color,
      pitchfork_width,
      pitchfork_style
   );
//--- If MQL5
#ifdef __MQL5__
//--- add external levels (early levels for Andrews' pitchfork)
   SetFiboLevels(_name,fibo_levels);
   SetFiboDescriptions(_name,fibo_descriptions);
#endif

//--- Update the chart picture
   ChartRedraw(0);
  }
第二个函数计算所创建草叉的点 1、2 和 3(基准)的坐标,并依次开始绘制所有三个对象。 基于此函数,调用上面的 CGraphics::MakePitchfork 函数绘制草叉。
//+------------------------------------------------------------------+
//| Draws set of Andrews' pitchforks on one base. The set includes    |
//|    three pitchfork types: regular, Schiff and reverse Schiff     |
//|    (aka "micmed channel")                                        |
//+------------------------------------------------------------------+
void CGraphics::DrawPitchforksSet(void)
  {
   bool up=true;                             // direction (mouse below or above the price)
   double dropped_price = CMouse::Price();   // "Starting point" price
   int dropped_bar = CMouse::Bar();          // Starting point bar number
   string name = "";                         // The name of the current object
   PitchforkPoints base;                     // Structure for the base coordinates
//---
   if(CMouse::Below())
     {
      up=false;
     }
   else
     {
      if(!CMouse::Above()) // If the mouse pointer is on the candlestick, do nothing
        {
         if(Print_Warning_Messages)
           {
            Print(DEBUG_MESSAGE_PREFIX,": Set a point above or below the bar extreme price");
           }
         return;
        }
     }
//--- Find extremum bar numbers
   int bar_first = CUtilites::GetNearestExtremumBarNumber(
                      dropped_bar,
                      true,
                      up,
                      Pitchfork_First_Point_Left_Bars,
                      Pitchfork_First_Point_Right_Bars
                   );
   int bar_second = CUtilites::GetNearestExtremumBarNumber(
                       bar_first-1,
                       true,
                       !up,
                       Pitchfork_Second_Point_Left_Bars,
                       Pitchfork_Second_Point_Right_Bars
                    );
   int bar_third = CUtilites::GetNearestExtremumBarNumber(
                      bar_second-1,
                      true,
                      up,
                      Pitchfork_Third_Point_Left_Bars,
                      Pitchfork_Third_Point_Right_Bars
                   );
//--- If not found, report an error
   if(bar_first<0||bar_second<0||bar_third<0)
     {
      if(Print_Warning_Messages)
        {
         Print(DEBUG_MESSAGE_PREFIX,": Could not find points that match all conditions.");
        }
      return;
     }

//--- Fill the structure for basic control points
   base.mainPointPrice = up ?                               // Price - first basic point
                         iHigh(Symbol(),PERIOD_CURRENT,bar_first)
                         : iLow(Symbol(),PERIOD_CURRENT,bar_first);
   base.secondPointPrice = up ?                             // Price - second basic point
                           iLow(Symbol(),PERIOD_CURRENT,bar_second)
                           : iHigh(Symbol(),PERIOD_CURRENT,bar_second);
   base.thirdPointPrice = up ?                              // Price - third basic point
                          iHigh(Symbol(),PERIOD_CURRENT,bar_third)
                          : iLow(Symbol(),PERIOD_CURRENT,bar_third);
   base.shiffMainPointPrice = base.mainPointPrice-          // Price - first point of Schiff pitchfork
                              (base.mainPointPrice-base.secondPointPrice)/2;
   base.reverceMainPointPrice = base.mainPointPrice+        // Price - first point of "reverse" pitchfork
                                (base.mainPointPrice-base.secondPointPrice)/2;
   base.time1 = iTime(Symbol(),PERIOD_CURRENT,bar_first);   // Time of the first point
   base.time2 = iTime(Symbol(),PERIOD_CURRENT,bar_second);  // Time of the second point
   base.time3 = iTime(Symbol(),PERIOD_CURRENT,bar_third);   // Time of the third point


//--- Draw "regular" pitchfork
   if(Pitchfork_Show_Main)
     {
      name =CUtilites::GetCurrentObjectName(allPrefixes[4]+"_main",OBJ_PITCHFORK);
      MakePitchfork(name,base,SIMPLE);
     }

//--- Draw Schiff pitchfork
   if(Pitchfork_Show_Shiff)
     {
      name =CUtilites::GetCurrentObjectName(allPrefixes[4]+"_shiff",OBJ_PITCHFORK);
      MakePitchfork(name,base,SHIFF);
     }

//--- Draw "reverse" pitchfork
   if(Pitchfork_Show_Reverce)
     {
      name =CUtilites::GetCurrentObjectName(allPrefixes[4]+"_reverce",OBJ_PITCHFORK);
      MakePitchfork(name,base,REVERCE);
     }
//---
//ChartRedraw(0); not needed here as it is called when drawing each object
  }
我用以下枚举来定义草叉类型:
//+------------------------------------------------------------------+
//| Possible Andrews' pitchfork types                                 |
//+------------------------------------------------------------------+
   enum PitchforkType
     {
      SIMPLE,
      SHIFF,
      REVERCE
     };
我为这些端点添加了一个结构( PitchforkPoints base ;),以便在调用绘图函数时向其传递更少的参数。
//+------------------------------------------------------------------+
//|  Structure describing a "base" for the Andrews' pitchfork         |
//+------------------------------------------------------------------+
   struct PitchforkPoints
     {
      double            mainPointPrice;        // Price - first base point
      double            shiffMainPointPrice;   // Price - second base point
      double            reverceMainPointPrice; // Price - third base point
      double            secondPointPrice;      // Price - first point of Schiff pitchfork
      double            thirdPointPrice;       // Price - first point of "reverse" pitchfork
      datetime          time1;                 // Time of the first point
      datetime          time2;                 // Time of the second point
      datetime          time3;                 // Time of the third point
     };
最后,在 “Shortcuts.mqh” 文件中的控制键上加入对其反应的说明:
//+------------------------------------------------------------------+
//|                                                   Shortcuts.mqhh |
//+------------------------------------------------------------------+

   //...
//--- Draw Andrews' Pitchfork
         if(CUtilites::GetCurrentOperationChar(Pitchfork_Key) == lparam)
           {
            m_graphics.DrawPitchforksSet();
           }
         break;
   //...
编译并检查。
为了在图表上显示草叉,请按 “P” 键(Pitchfork)。
MetaTrader 中的趋势线绘图功能
通常,上述对象可用于任何图形。 该功能支持直线、安德鲁草叉、斐波那契扇形、水平和垂直级别。
与此类似,通过查找在鼠标右侧或左侧的极值点,我们可以绘制通道、水平斐波那契级别、等等。 如果您经常使用这些形状,则可以轻松实现所需的功能。
对我来说,这个函数库中最困难的部分涉及到那种一个端点在右边,而第二个端点在未来的直线。
这样的直线能非常方便地依据价格和时间标记显著的级别。 作为规则,价格会注意到这些级别,并至少在附近某个位置形成局部极值,价格于该处经常反转。
但事实证明,MetaTrader 中的直线绘制功能采用价格和时间。
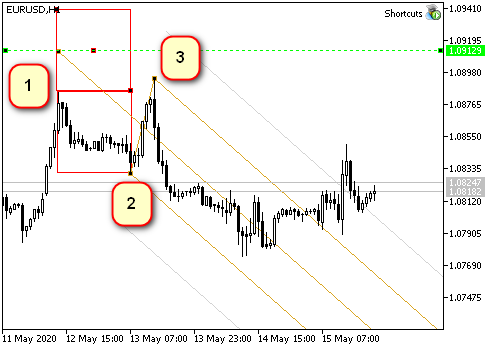
当在星期五绘制直线,且其右侧为星期一时,会出现第一个问题。

在星期五,MetaTrader 认为必须有星期日,但随后在星期一才知道,该日期不能进行交易,因此必须丢弃两天。 由此,依据时间坐标绘制的直线会更短。 在上图中可以清晰地看到这一点。
如果我需要在图表上测量一定数量的柱线,则此行为极不方便。
解决方案非常简单:日期不必通过日历计算,而是依据点位。 鼠标坐标在图表上显示一个点;烛条之间的距离始终可以计算(例如,如第一篇文章中“相邻柱线之间的距离(以像素为单位)”章节所述),然后我们只需为所需数量的烛条进行计数,然后使用标准的 ChartXYToTimePrice 函数将屏幕坐标转换为时间和价格。 但为了避免“星期日塌陷”,应该在星期一绘制这条直线,而不是在星期五。
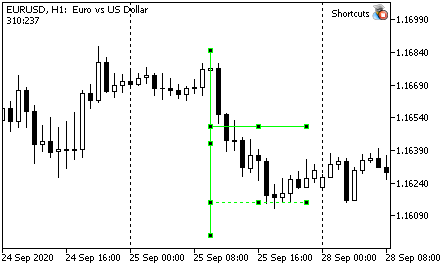
该方法似乎不错,但有一点瑕疵。 MetaTrader 可在其上画线的空间大小是有限的。 如果您试图画一条长线,超出程序允许的空间(例如,非常靠近边框,如左图所示),则效果可能非常出乎意料。
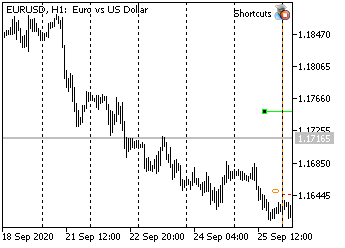
右图示意自动绘制的同一条线,但现在图表向右偏移,以便显示右边框。 其下是本该在此尺度上的正常直线。 从上边的直线属性来看,它的右端点超前了将近六个月!
有时,加一条斜线,我能看到这条线是如何往相反方向逆转的。 MetaTrader 无法将点位的坐标转换为正确的日期,只能将其设置为 0(相应地,日期为 1970 年 1 月 1 日)。 如果线段是依据日期来绘制,则这种效果永远不会发生。
结论:我们需要一个函数来计算尚未确定的未来日期,以便绘制直线。
因此,我们来创建这样的函数。
获取未来日期的函数
通常,现在或过去存在某些要测量的点(例如,某种极值)。 再加上,我们通常要么知道以柱线为单位的偏移距离,要么可以轻松地计算它。 如此,该函数最常见的任务是基于柱线图的偏移来计算相对于某个点位的时间。 然而,我还是喜欢根据比例缩放级别的效果。 故此,有时我想让函数依据点位而非柱线来计算时间。
点位的数量和柱线的数量都是整数,因此,该函数需要某种功能才能确切地理解如何去做。 我们从此功能开始。
//+------------------------------------------------------------------+
//|                                              GlobalVariables.mqh |
//+------------------------------------------------------------------+

//...
//+------------------------------------------------------------------+
//| The enumeration describes possible options for calculating the   |
//|   time of the next bar                                           |
//|      COUNT_IN_BARS - calculate date by the number of bars        |
//|      COUNT_IN_PIXELS - calculate date by the number of pixels    |
//+------------------------------------------------------------------+
enum ENUM_FUTURE_COUNT {
   COUNT_IN_BARS,    // By bars
   COUNT_IN_PIXELS   // By pixel
};
//...
枚举和全局变量的所有描述都在 GlobalVariables.mqh 文件之中。 作为我们未来函数选择间隔的可能选项,还应添加枚举到此文件当中。
该函数本身不绘制任何东西,且与鼠标无关。 因此,它必须是一个实用工具。
//+------------------------------------------------------------------+
//|                                                     Utilites.mqh |
//+------------------------------------------------------------------+

//...
class CUtilites
  {
public:
//...
   //--- Calculates a date in the future relative to the start date with the _length interval, specified in pixels or bars
   static datetime          GetTimeInFuture(
      const datetime _start_time,                         // Reference time based on which the future bar is calculated
      const int _length,                                  // Interval length (in bars or pixels)
      const ENUM_FUTURE_COUNT _count_type=COUNT_IN_BARS   // Interval type (pixels or bars).
   );

//...

//+------------------------------------------------------------------+
//| The function tries to calculate date in the future using the     |
//|   screen x and y coordinates                                     |
//| If calculation is unsuccessful (time exceeds limits), calculates |
//|   time with an error: as a sum of dates excluding Sundays.       |
//| Parameters:                                                      |
//|   _current_time,              Source time,                       |
//|   _length,                    Interval length                    |
//|                                 (in bars or in pixels)           |
//|   _count_type=COUNT_IN_BARS   How interval length is measured.   |
//|      COUNT_IN_BARS - the interval is set in bars;                |
//|      COUNT_IN_PIXELS - the interval is set in pixels.            |
//| Returns:                                                         |
//|   Time in the future distant from the _current_time              |
//|      by an interval in pixels or bars (_length)                  |
//+------------------------------------------------------------------+
datetime CUtilites::GetTimeInFuture(
   const datetime _start_time,                         // Reference time based on which the future bar is calculated
   const int _length,                                  // Interval length (in bars or pixels)
   const ENUM_FUTURE_COUNT _count_type=COUNT_IN_BARS   // Interval type (pixels or bars).
)
  {
//---
   datetime
      future_time;      // Variable for result
   int
      bar_distance =  GetBarsPixelDistance(),   // Distance in pixels between two adjacent bars
      current_x,                                // The x coordinate of the starting point
      future_x,                                 // The x coordinate of the result
      current_y,                                // The y coordinate, does not affect the result; needed for the conversion function
      subwindow = 0;                            // Subwindow index
   double current_price;                        // Any initial price, does not affect the result


//--- Convert the time passed in parameters into the screen coordinate x
   ChartTimePriceToXY(0,subwindow,_start_time,CMouse::Price(),current_x,current_y);

//--- Calculate a point in the future in screen coordinates
   if(COUNT_IN_BARS == _count_type) // If the length is specified in bars,
     {
      // then the interval size should be converted to pixels.
      future_x = current_x + _length*bar_distance;
     }
   else // ... If the length is in pixels,
     {
      // use it as is
      future_x = current_x + _length;
     }

//--- Convert screen coordinates into time
   if(ChartGetInteger(0,CHART_WIDTH_IN_PIXELS)>=future_x) // If successful,
     {
      ChartXYToTimePrice(0,future_x,current_y,subwindow,future_time,current_price);  // convert the resulting value
     }
   else // Otherwise, if time cannot be calculated because it exceeds limits
     {
      future_time =        // Calculate time as usual, in seconds
         _start_time       // To the starting time
         +(                // add
            ((COUNT_IN_BARS == _count_type) ? _length : _length/bar_distance) // interval size in bars
            *PeriodSeconds()  // multiplied by the number of seconds in the current period
         );
     }
//--- Return the resulting value
   return future_time;
  }
然而,事实证明,先前版本中描述的函数并不总是会产生正确的结果。 这就是为什么我不得不重写它。 一切都变得简单很多。
//+------------------------------------------------------------------+
//|                                                     Utilites.mqh |
//+------------------------------------------------------------------+
//...
//+------------------------------------------------------------------+
//| Calculates a distance in pixels between two adjacent bars        |
//+------------------------------------------------------------------+
int        CUtilites::GetBarsPixelDistance(void)
  {
//--- Calculate the distance
   return ((int)MathPow(2,ChartGetInteger(0,CHART_SCALE)));
  }
//...
受限的水平级别
我在上一章节中展示了这些级别。 它是一定长度的线段,理想情况下并不取决于您将鼠标指向何处。 它从鼠标光标指向的点位开始绘制。 因此,相比于扇形,选择一个点位要更谨慎。
我希望这些级别是具有严格定义的长度(根据经验),以像素为单位。 然后,该线段在不同比例下将覆盖不同数量的柱线。
另外,我希望能够编写一个正常线段级别,和一个扩展的 - 都在相同的尺度上。
此处是我们的所得:
//+------------------------------------------------------------------+
//|                                                     Graphics.mqh |
//+------------------------------------------------------------------+

//+------------------------------------------------------------------+
//| Draws a horizontal level                                         |
//| Parameters:                                                      |
//|   _multiplicator - multiplier for determining the length         |
//|                of the larger level (how many times higher)       |
//+------------------------------------------------------------------+
//---
void CGraphics::DrawHorizontalLevel(
   double _multiplicator // Multiplier for the level length
)
  {
//--- Description of variables
   datetime p2_time;          // Time of point 2
   string Level_Name ="";     // Level name

//Color of the current line (equal to  the general color of the current time interval)
   color Level_Color=CUtilites::GetTimeFrameColor(CUtilites::GetAllLowerTimeframes());
   int window = 0;            // The index of the subwindow in which the line is drawn
   ENUM_LINE_STYLE Current_Style = STYLE_SOLID; // Line style
   int Current_Width=1;                         // Line width
   int level_length = 0;                        // Line length

//--- Get the length (in pixels)
   if(Short_Level_Length_In_Pixels)
     {
      // If EA parameters instruct to measure in pixels,
      level_length = Short_Level_Length_Pix; // ...Use the length from parameters
     }
   else
     {
      // Otherwise the number of candlesticks is specified in parameters
      level_length = Short_Level_Length * CUtilites::GetBarsPixelDistance();
     }

//--- Set level parameters
   if(_multiplicator>1) // If the level is extended
     {
      Level_Name = CUtilites::GetCurrentObjectName(allPrefixes[7]);
      Current_Style = Long_Level_Style;
      Current_Width = Long_Level_Width;
     }
   else                 // An if the level is short
     {
      Level_Name = CUtilites::GetCurrentObjectName(allPrefixes[6]);
      Current_Style = Short_Level_Style;
      Current_Width = Short_Level_Width;
     }

//--- Calculate real coordinates (price and time) for the second point
   p2_time = CUtilites::GetTimeInFuture(CMouse::Time(),level_length*_multiplicator,COUNT_IN_PIXELS);


//--- Draw a line using the known coordinates
   TrendCreate(0,
               Level_Name,
               0,
               CMouse::Time(),
               CMouse::Price(),
               p2_time,
               CMouse::Price(),
               Level_Color,
               Current_Style,
               Current_Width
              );
//---

   ChartRedraw(0);
  }
第一点位由鼠标指针确定。 在计算第二个点位时,程序首先 选择线段大小是否应随图表比例的变化而变化,然后计算第二个点位的坐标(以像素为单位),并据其重新计算转化为价格和时间。 (若您已有现成函数,计算并不会很困难)。
现在我们需要向 Shortcuts.mqh 文件中添加控制命令:
//+------------------------------------------------------------------+
//|                                                    Shortcuts.mqh |
//+------------------------------------------------------------------+

// ...

//--- Draw a short limited level
         if(CUtilites::GetCurrentOperationChar(Short_Level_Key) == lparam)
           {
            m_graphics.DrawHorizontalLevel(1);
           }
//--- Draw an extended limited level
         if(CUtilites::GetCurrentOperationChar(Long_Level_Key) == lparam)
           {
            m_graphics.DrawHorizontalLevel(Long_Level_Multiplicator);
           }
// ...
结果就是,若 Short_Level_Length_In_Pixels 参数为 true,则当按下 S (Short)键,程序将绘制一个水平线段,其长度以 Short_Level_Length_Pix 参数中指定的像素为单位。
若 Short_Level_Length_In_Pixels == false,则级别长度以烛条数量度量,且其值取自 Short_Level_Length 参数。
若您按下 "L" (Long),则线段长度加倍 (会乘以 Long_Level_Multiplicator 参数内指定的数字)。
受限的趋势线
我相信趋势线可以承受双倍负荷。
一方面,它显示了价格变化率的限制(如果价格低于该趋势线,则为“不快” ;如果价格低于该趋势线,则为“不慢” , 价格高于上限)。
另一方面,如果直线受价格和时间的限制(不是射线),则可以作为级别指示(价格和时间两者)。 当然,出于这些目的,我们可以使用矩形或其他形状,但是我认为对角线更清晰。
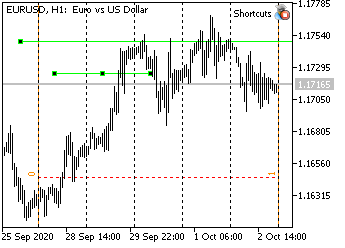
因此,我修改了 Graphics::DrawTrendLine 函数。 首先,这条线现在会在有限时间内持续到未来,因此可指示估价。 其次,为清楚起见,我添加了通常的级别 - 水平和垂直。
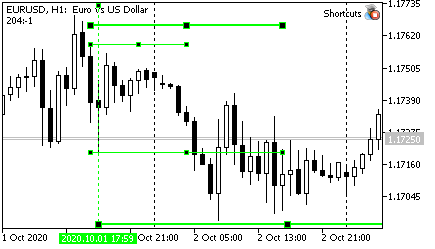
看起来像这样:

当然,线段的长度(总长度大于起始点之间的距离的多少倍),极值的柱线数量以及直线的其他特征都在 EA 参数中配置。
//+------------------------------------------------------------------+
//|                                                     Graphics.mqh |
//+------------------------------------------------------------------+

//+------------------------------------------------------------------+
//| Draws a trend line using two nearest extreme points.             |
//|   Extremum length (number of bars on left and right) is set      |
//|   by parameters Fractal_Size_Left and Fractal_Size_Right         |
//|                                                                  |
//| There is a "Trend_Points" variable in the global parameters.     |
//|                                                                  |
//| If the variable value is equal to "TREND_DOTS_EXTREMUMS",        |
//|   end points of the straight line will lie strictly at extrema.  |
//| If the values is "TREND_DOTS_HALF", the line will be             |
//|   extended into the future by a distance of                      |
//|   (p2-p1)*Trend_Length_Coefficient                               |
//+------------------------------------------------------------------+
void              CGraphics::DrawTrendLine(void)
  {
   int dropped_bar_number=CMouse::Bar(); // candlestick number under the mouse
   int p1=0,p2=0;                        // numbers of the first and seconds points
   string trend_name =                   // trend line name
      CUtilites::GetCurrentObjectName(allPrefixes[0],OBJ_TREND);
   double
      price1=0,   // price of the first point
      price2=0,   // price of the second point
      tmp_price;  // variable for temporary storing of the price
   datetime
      time1=0,    // time of the first point
      time2=0,    // time of the second point
      tmp_time;   // a variable to store time


//--- Setting initial parameters
   if(CMouse::Below()) // If a mouse cursor is below the candlestick Low
     {
      //--- Find two extreme points below
      CUtilites::SetExtremumsBarsNumbers(false,p1,p2);

      //--- Determine point prices by Low
      price1=iLow(Symbol(),PERIOD_CURRENT,p1);
      price2=iLow(Symbol(),PERIOD_CURRENT,p2);
     }
   else // otherwise
      if(CMouse::Above()) // If a mouse cursor is below the candlestick High
        {
         //--- Find two extreme points above
         CUtilites::SetExtremumsBarsNumbers(true,p1,p2);

         //--- Determine point prices by High
         price1=iHigh(Symbol(),PERIOD_CURRENT,p1);
         price2=iHigh(Symbol(),PERIOD_CURRENT,p2);
        }
      else
        {
         return;
        }
//--- The time of the first and second points does not depend on the direction
   time1=iTime(Symbol(),PERIOD_CURRENT,p1);
   time2=iTime(Symbol(),PERIOD_CURRENT,p2);

//--- If the line should be extended to the right
   if(Trend_Points == TREND_POINTS_HALF)
     {
      //--- Temporarily save the coordinates of point 2
      tmp_price = price2;
      tmp_time = time2;

      //--- Calculate the time of the second point
      time2 = CUtilites::GetTimeInFuture(time1,(p1-p2)*Trend_Length_Coefficient);

      //--- Calculate the price of the second point
      price2 = NormalizeDouble(price1 + (tmp_price - price1)*Trend_Length_Coefficient,Digits());

      //--- Draw boundary levels by price and time
      DrawSimple(OBJ_HLINE,time2,price2);
      DrawSimple(OBJ_VLINE,time2,price2);
     }

//--- Draw the line
   TrendCreate(0,trend_name,0,
               time1,price1,time2,price2,
               CUtilites::GetTimeFrameColor(CUtilites::GetAllLowerTimeframes()),
               0,Trend_Line_Width,false,true,m_Is_Trend_Ray
              );

//--- Redrawing the chart
   ChartRedraw(0);
  }
代码中的其他修改以黄色高亮显示。
其余的很简单。 点位之间的柱线数量等于(р1-р2)(请注意,柱线编号向右增加)。 系数能够由间隔扩展多少来计算。 然后,即使没有指定第三个参数,也可以简单地调用实用工具函数,因为默认情况下它能够以柱线为单位进行计算。
然后计算价格,使用先前讲述的位于同一个类里的 DrawSimple 函数绘制级别,并绘制主线。
初学者可能会问:“函数如何“知道”应该在何处添加价格:向上还是向下? 如果该线段从上至下,则应减去价格,而从下至上,则应加上价格。”
请注意,鉴于对我们来说,链接到低点还是链接到高点并不重要(我们已经在函数开始处进行了检查),因此方向由表达式 price1 + (tmp_price - price1) 唯一判定。
如果线段向下,则 price1 将大于第二个点位的价格,因此,表达式(tmp_price-price1)为负。 因此,所需的距离将从价格中 扣除。
如果线向上,则定义第二个点位的价格将大于第一个点位,且括号中的表达式将为正,因此距离将被加上初始价格。
我想提一下此函数的另一个功能; 这是针对初学者的解释。 如果函数计算价格,则必须将数据常规化。 也就是说,我们需要确保接收到的数字与图表上的报价拥有相同的小数位数。 否则,将会发生错误。 NormalizeDouble 函数即用于规范价格。
无需在 Shortcuts.mqh 文件中进行任何修改。 按下 "T" 键 (Trend) 即可绘制该直线。 因此,应调用上述函数来画线。
//+------------------------------------------------------------------+
//|                                                    Shortcuts.mqh |
//+------------------------------------------------------------------+

//...
//--- Draw a trend line
         if(CUtilites::GetCurrentOperationChar(Trend_Line_Key) == lparam)
           {
            m_graphics.DrawTrendLine();
           }
//...
绘制垂直级别
由于行情具有趋势性,且价格走势并非完全随机,因此通常可以使用以下规则进行交易:价格总是倾向于按照刚过去的相同距离移动。 走势的方向是一个单独的问题。 通常,在突破之后,譬如尖峰柱线、或某些较大烛条的边缘后,价格移动的距离与所测量柱线相同,然后反转。
尽管如此,许多交易大户(最终能判断方向的那些人)更愿意在达到 100% 级别之前提早平仓。 因此,价格经常不能达到众所期待级别。
因此,我也使用局部级别进行交易。 最经常使用的级别是 7/8。 我们将在本文中研究的最后一个工具即设计用于在屏幕上显示这些级别。
现在,绘制级别的函数应该很容易理解。
//+------------------------------------------------------------------+
//|                                                     Graphics.mqh |
//+------------------------------------------------------------------+

//+------------------------------------------------------------------+
//| Draws a vertical line at levels 7/8 and 14/8 of the              |
//|   current candlestick size                                       |
//+------------------------------------------------------------------+
void CGraphics::DrawVerticalLevels(void)
  {
//--- Description of variables
   string
   Current_Vertical_Name =   // The name of the basic vertical line
      CUtilites::GetCurrentObjectName(allPrefixes[5]),
      Current_Level_Name =          // The name of the current level
         CUtilites::GetCurrentObjectName(allPrefixes[5]+"7_8_");
   double
   Current_Line_Lenth,           // The length of the current line (level or vertical)
   Current_Extremum,             // Working extremum (High or Low, depending on the mouse position
   Level_Price,                  // Level price
   High = iHigh(Symbol(),PERIOD_CURRENT,CMouse::Bar()), // The High price of the current candlestick
   Low =  iLow(Symbol(),PERIOD_CURRENT,CMouse::Bar());  // The Low price of the current candlestick
   int
   direction=0;                  // Price increment sign
   long timeframes;                 // List of working timeframes
   datetime
   Current_Date =                // Time of the current bar
      iTime(Symbol(),PERIOD_CURRENT,CMouse::Bar()),
      Right_End_Time =              // Time of the right border of the level
         CUtilites::GetTimeInFuture(Current_Date,Short_Level_Length);

//--- Calculating candlestick length
   Current_Line_Lenth = (High-Low)*2;

//--- Initialization of the main variables depending on the desired drawing direction
   if(CMouse::Above()) // If the mouse is above
     {
      Current_Extremum = High;   // The main price is High
      direction = -1;            // Drawing direction - downward
     }
   else              // Otherwise
     {
      if(CMouse::Below()) // If the mouse is below
        {
         Current_Extremum = Low; // The main price is Low
         direction = 1;          // Drawing direction is upward
        }
      else         // If the mouse is in the middle of the candlestick, exit
        {
         return;
        }
     }

//--- Vertical line
   TrendCreate(0,
               Current_Vertical_Name,
               0,
               Current_Date,
               Current_Extremum,
               Current_Date,
               Current_Extremum+(Current_Line_Lenth*2)*direction,
               CUtilites::GetTimeFrameColor(CUtilites::GetAllLowerTimeframes()),
               Vertical_With_Short_Levels_Style,
               Vertical_With_Short_Levels_Width
              );
//--- First level (7/8)
   Level_Price = Current_Extremum+(Current_Line_Lenth*Vertical_Short_Level_Coefficient)*direction;
   TrendCreate(0,
               Current_Level_Name,
               0,
               Current_Date,
               Level_Price,
               Right_End_Time,
               Level_Price,
               CUtilites::GetTimeFrameColor(CUtilites::GetAllLowerTimeframes()),
               Short_Level_7_8_Style,
               Short_Level_7_8_Width
              );
//--- Second level (14/8)
   Current_Level_Name = CUtilites::GetCurrentObjectName(allPrefixes[5]+"14_8_");
   Level_Price = Current_Extremum+(Current_Line_Lenth*2*Vertical_Short_Level_Coefficient)*direction;
   TrendCreate(0,
               Current_Level_Name,
               0,
               Current_Date,
               Level_Price,
               Right_End_Time,
               Level_Price,
               CUtilites::GetTimeFrameColor(CUtilites::GetAllLowerTimeframes()),
               Short_Level_14_8_Style,
               Short_Level_14_8_Width
              );
  }
请注意两点。 首先,此处这些级别的时间始终以柱线为单位计算。 所需的柱线数量取自 Short_Level_Length 变量,因此,我始终知道应测量多少根柱线。
其次,此处,您在计算价格时仅能基于一个点位。 因此,有必要设置方向相关参数,这样您就不必每次都重复检查,并编写双倍的代码。 特别是,我们设置了 direction 参数,除第一个点位外,每项都要与该参数相乘。 因此,我仍然只有一个表达式来描述线段的行为,但该表达式中术语的符号取决于鼠标的位置:烛条上方或下方。
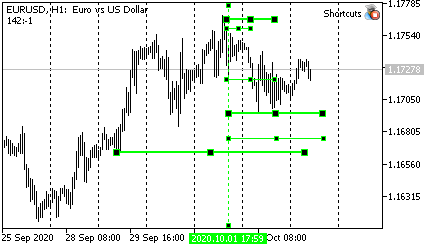
最终形状如上图所示。
将控制结构添加到 Shortcuts.mqh 文件之中:
//+------------------------------------------------------------------+
//|                                                    Shortcuts.mqh |
//+------------------------------------------------------------------+

//...
//--- Draw a vertical line with 7/8 levels
         if(CUtilites::GetCurrentOperationChar(Vertical_With_Short_Levels_Key)  == lparam)
           {
            m_graphics.DrawVerticalLevels();
           }
         break;
键盘是 V (Vertical)。
当前函数库实现的按键
| 动作 | 按键 | 含义 |
|---|---|---|
| 依据主要的TFs (来自 TFs 面板) 向上改变时间帧 | U | Up |
| 向下改变时间帧 | D | Down |
| 改变图表 Z 级别 (图表是否位于所有对象之上) | Z | Z order |
| 基于最接近鼠标的两个单向极端点绘制一条坡度趋势线 | T | Trend line |
| 切换新线的射线模式 | R 键 | Ray |
| 绘制一条简单垂线 | I(i) | [仅可见垂直] |
| 绘制一条简单水平线 | H | Horizontal |
| 绘制安德鲁草叉 | P | Pitchfork |
| 绘制斐波那契扇形 (VFun) | F key | Fun |
| 绘制一条短水平级别 | S | Short |
| 绘制一个扩展水平级别 | L key | Long |
| 绘制一个带有级别标记的垂线 | V | Vertical |
结束语
我希望这篇文章会有所帮助,但我不保证任何事情。 产生的工具包非常灵活,适合在任何行情上运用。 不过,如果文章读者开始时以默认设置使用它,则行情可能会发生变化。 大概不会明显,因为变化是行情的本质。
欢迎您分享您的见解和想法。
祝您稳定盈利!