一、综合走势与波动率
沪深300指数
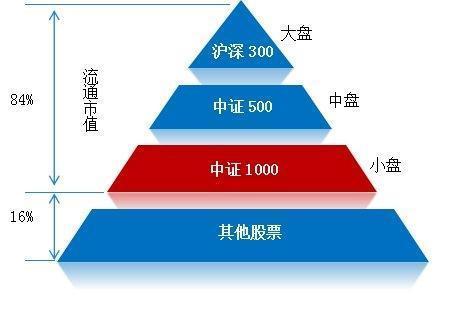
它以规模和流动性作为选样的两个根本标准,并赋予流动性更大的权重,符合该指数定位于交易指数的特点。300指数反映的是流动性强和规模大的代表性股票的股价的综合变动,可以给投资者提供权威的投资方向,也便于投资者进行跟踪和进行投资组合,保证了指数的稳定性、代表性和可操作性。
中证500指数
该指数又称中证小盘500指数(CSI Smallcap 500 index),简称中证500(CSI 500),上海行情代码为000905,深圳行情代码为399905。中证500指数有3个构建步骤。
步骤1 样本空间内股票扣除沪深300指数样本股即最近一年日均总市值排名前300名的股票;
步骤2 将步骤1中剩余股票按照最近一年(新股为上市以来)的日均成交金额由高到低排名,剔除排名后20%的股票;
步骤3 将步骤2中剩余股票按照日均总市值由高到低进行排名,选取排名在前500名的股票作为中证500指数样本股。

中证1000指数
根据金融界网站提供的资料,中证1000指数编制方法采用较为普遍的自由流通市值加权法,指数成分股从全部A股中剔除沪深300、中证500指数成分股后,结合流动性标准选取过去一年日均总市值最大的1000只股票,综合反映中国A股市场中小市值公司的股票价格表现,是中证核心市值指数体系的重要组成部分。
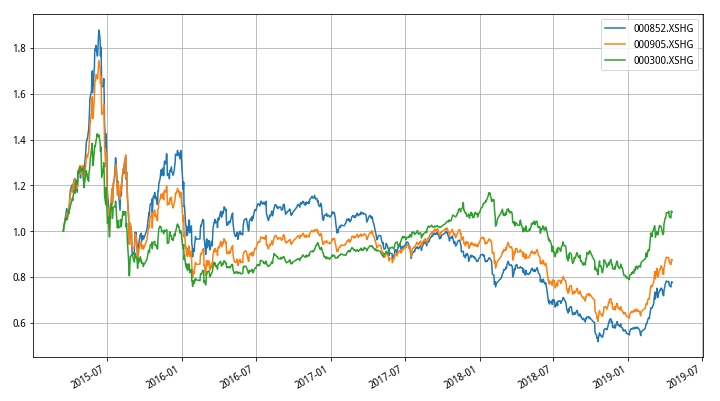
我们通过聚宽研究平台,首先构建一个list名单“index_list”,然后通过get_price函数调取数据,然后将数据处理成净值,绘制出来,得到以下效果:

我们定日期2019-04-18为截止日期,向前推1000天,发现最近4年来,表现最差的其实是中证1000指数,说明了在市场长期价值筛选中,小盘股出现了显著的估值下滑和资金流出。而之前大家对于小盘股的印象则是高波动率和高回报率。
上图就是三大指数的波动率情况,还是同一个时间段,我们使用移动窗口标准差,再除以该窗口期内的价格均值,去价格量纲得到这个曲线,通过研究平台文件我们输出波动率具体值为:
000852.XSHG 0.034911
000905.XSHG 0.030969
000300.XSHG 0.023826
这表示000852.XSHG中证1000指数在全段时间的波动率是最高的,通过蓝线也可以清晰看出。而沪深300由于大盘股较多,波动率偏低,中证500居中。

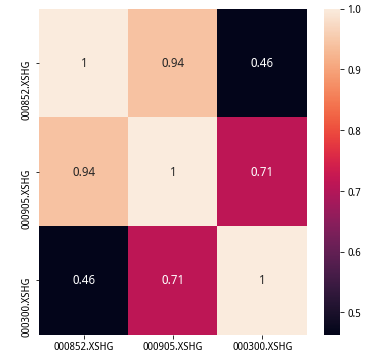
这三大指数之间有何种相关关系呢?实际上从走势看,它们毕竟都属于中国股票市场,应该非常相关,我们抱着这个疑问,绘制了全段价格相关性和全段波动率相关性,试图寻找答案。


绘制相关性矩阵需要导入seaborn包,其heatmap函数就是专门用于热力标色的矩阵图绘制的。分析结果显示,三大指数的走势相关性并不十分高,特别是沪深300和中证1000差异最大。而波动率相关性分析则体现出更高的结果,说明在出现较大波动时刻,指数的共振还是很明显的,这表现出较高的系统性风险。
import numpy as np
import matplotlib.pyplot as plt
import pandas as pd


# 指数成分股,总市值
q_50 = query(
 valuation.code, valuation.market_cap
).filter(
    # valuation.code.in_(get_index_stocks('000852.XSHG'))  #中证1000
    # valuation.code.in_(get_index_stocks('000905.XSHG')) #中证500
    valuation.code.in_(get_index_stocks('000300.XSHG')) #沪深300
).order_by(
    valuation.market_cap.desc())
df_50 = get_fundamentals(q_50, '2019-01-01')
df_50.head()
| code | market_cap | |
|---|---|---|
| 0 | 601398.XSHG | 18853.8906 |
| 1 | 601939.XSHG | 15925.6992 |
| 2 | 601857.XSHG | 13195.8125 |
| 3 | 601288.XSHG | 12599.3896 |
| 4 | 601988.XSHG | 10627.3994 |
# 指数成分股,总市值绘图
import matplotlib.pyplot as plt

plt.figure(figsize=(10,5))
plt.bar(range(len(list(df_50.market_cap))), list(df_50.market_cap),edgecolor='blue')
plt.title('排序后市值分布')
plt.show()
# 绘制直方图

plt.figure(figsize=(10,5))
plt.hist(df_50.market_cap, bins=50)
plt.xlabel('stocks')
plt.ylabel('Number of market_cap')
plt.title('直方图分布')
plt.show()
# 指数成分股,相关统计数据

# 均值
market_cap_mean_50 = mean(list(df_50.market_cap))

# 中位数
market_cap_median_50 = median(list(df_50.market_cap))

# 标准差
market_cap_std_50 = std(list(df_50.market_cap))

# 极差
market_cap_ptp_50 = ptp(list(df_50.market_cap))


print('均值:',market_cap_mean_50,'中位数:',market_cap_median_50,'标准差:',market_cap_std_50,'极差:',market_cap_ptp_50)
均值: 979.8816889999999 中位数: 381.9389 标准差: 2070.650186717265 极差: 18721.7925
"""
绘制箱体图
Created on 2017.09.04 by ForestNeo
"""
import numpy as np
import matplotlib.pyplot as plt
import pandas as pd


def list_generator(number, min, max):
    dataList = list()
    for i in range(1, number):
        dataList.append(np.random.randint(min, max))
    return dataList

list1 = list_generator(100, 20, 80)

data = pd.DataFrame({
    "dataSet1":list1,
})

df_50.boxplot(figsize = (4,5))
plt.title('成分股市值箱体图')
plt.show()
# 求出每一只个股的sw_l1申万一级行业名称
# 同时使用try和pass跳过错误

import numpy as np
import matplotlib.pyplot as plt
import pandas as pd

industry = get_industry(list(df_50.code))

stock_dict={}

for stock in industry.keys():
    try:
        stock_dict[stock] = industry[stock]['sw_l1']['industry_name'] # 取到每个股票的【申万一级】行业名称
    except:
        pass

# 转换为DF数据格式
DFindustry = pd.DataFrame(list(stock_dict.values()),index=stock_dict.keys(),columns=['industry_name'])
DFindustry.head()
| industry_name | |
|---|---|
| 601398.XSHG | 银行I |
| 601939.XSHG | 银行I |
| 601857.XSHG | 采掘I |
| 601288.XSHG | 银行I |
| 601988.XSHG | 银行I |
# 绘制行业分布饼图

import numpy as np
import matplotlib.pyplot as plt

tt = DFindustry.groupby(['industry_name']).size()
tt1 = list(tt.index.values)
tt2 = list(tt.values)

labels = tt1
fracs = tt2

plt.figure(figsize=(10,8))

plt.axes(aspect=1)  # set this , Figure is round, otherwise it is an ellipse
plt.pie(x=fracs, labels=labels, explode=None,autopct='%3.1f %%',shadow=True)
plt.title('成分股行业分布饼图')
plt.show()

# 分布行业数量
industryN = len(tt1)

# 每个行业平均个股数量
average_N = np.array(tt2).mean()

# 每个行业个股数量标准差
STD_N = np.array(tt2).std()

# 每个行业个股分布变异系数
CV_N = STD_N / average_N

print('行业数量:',industryN,'平均个股数量:',average_N,'个股数量标准差:',STD_N,'个股分布变异系数:',CV_N)
行业数量: 28 平均个股数量: 10.714285714285714 个股数量标准差: 8.06162489318173 个股分布变异系数: 0.7524183233636281
# 成交额分析
money_test = get_price( list(df_50.code), start_date='2018-01-01', end_date='2019-01-01', frequency='daily', fields=None, skip_paused=False, fq='none', count=None)
money_test
/opt/conda/lib/python3.6/site-packages/jqresearch/api.py:87: FutureWarning:
Panel is deprecated and will be removed in a future version.
The recommended way to represent these types of 3-dimensional data are with a MultiIndex on a DataFrame, via the Panel.to_frame() method
Alternatively, you can use the xarray package http://xarray.pydata.org/en/stable/.
Pandas provides a `.to_xarray()` method to help automate this conversion.

  pre_factor_ref_date=_get_today())
<class 'pandas.core.panel.Panel'>
Dimensions: 6 (items) x 243 (major_axis) x 1000 (minor_axis)
Items axis: open to money
Major_axis axis: 2018-01-02 00:00:00 to 2018-12-28 00:00:00
Minor_axis axis: 600675.XSHG to 000533.XSHE
money_sort = money_test.money.mean().sort_values(ascending=False)

plt.figure(figsize=(10,5))
plt.bar(range(len(list(money_sort))), list(money_sort),edgecolor='blue')
plt.ylabel('成交额')
plt.title('成分股过去1年的日成交额均值')
plt.show()

print('成分股过去1年的日成交额均值的均值:',money_sort.mean())
print('成分股过去1年的日成交额均值的中位数:',money_sort.median())
成分股过去1年的日成交额均值的均值: 87428215.15707137
成分股过去1年的日成交额均值的中位数: 64825951.951790154
close_sort = money_test.close.mean().sort_values(ascending=False)

plt.figure(figsize=(10,5))
plt.bar(range(len(list(close_sort))), list(close_sort),edgecolor='blue')
plt.ylabel('不复权收盘价')
plt.title('成分股过去1年的不复权收盘价均值')
plt.show()


print('成分股过去1年的不复权收盘价均值的均值:',close_sort.mean())
print('成分股过去1年的不复权收盘价均值的中位数:',close_sort.median())
成分股过去1年的不复权收盘价均值的均值: 14.702834740847802
成分股过去1年的不复权收盘价均值的中位数: 10.150185185185187
# 通过rolling_mean函数求去价格量纲的波动率

mov_std = money_test.close.rolling(20).std() / money_test.close.rolling(20).mean()

std_sort = mov_std.mean().sort_values(ascending=False)

std_sort

plt.figure(figsize=(10,5))
plt.bar(range(len(list(std_sort))), list(std_sort),edgecolor='blue')
plt.ylabel('去价格量纲的波动率均值')
plt.title('去价格量纲的波动率均值')
plt.show()


print('成分股过去1年的去价格量纲的波动率均值:',std_sort.mean())
print('成分股过去1年的去价格量纲的波动率的中位数:',std_sort.median())
成分股过去1年的去价格量纲的波动率均值: 0.049612019004642856
成分股过去1年的去价格量纲的波动率的中位数: 0.04807667850236288
# ER效率系数

date_list = []
df_ER = pd.DataFrame()
for i in range(20,len(money_test.close)):
    temp = money_test.close.iloc[i-20:i,:]
    Direction = abs(temp.iloc[0,:] - temp.iloc[-1,:])
    Volatility = ((temp - temp.shift(1)).abs()).sum()
    ER = Direction/Volatility
    date = money_test.close.index.tolist()[i].date()
    df_ER = df_ER.append(pd.DataFrame(ER).T)

    date_list.append(date)
    print(date)
df_ER.index = date_list
print(df_ER.head())
2018-01-30
2018-01-31
2018-02-01
2018-02-02
2018-02-05
2018-02-06
2018-02-07
2018-02-08
2018-02-09
2018-02-12
2018-02-13
2018-02-14
2018-02-22
2018-02-23
2018-02-26
2018-02-27
2018-02-28
2018-03-01
2018-03-02
2018-03-05
2018-03-06
2018-03-07
2018-03-08
2018-03-09
2018-03-12
2018-03-13
2018-03-14
2018-03-15
2018-03-16
2018-03-19
2018-03-20
2018-03-21
2018-03-22
2018-03-23
2018-03-26
2018-03-27
2018-03-28
2018-03-29
2018-03-30
2018-04-02
2018-04-03
2018-04-04
2018-04-09
2018-04-10
2018-04-11
2018-04-12
2018-04-13
2018-04-16
2018-04-17
2018-04-18
2018-04-19
2018-04-20
2018-04-23
2018-04-24
2018-04-25
2018-04-26
2018-04-27
2018-05-02
2018-05-03
2018-05-04
2018-05-07
2018-05-08
2018-05-09
2018-05-10
2018-05-11
2018-05-14
2018-05-15
2018-05-16
2018-05-17
2018-05-18
2018-05-21
2018-05-22
2018-05-23
2018-05-24
2018-05-25
2018-05-28
2018-05-29
2018-05-30
2018-05-31
2018-06-01
2018-06-04
2018-06-05
2018-06-06
2018-06-07
2018-06-08
2018-06-11
2018-06-12
2018-06-13
2018-06-14
2018-06-15
2018-06-19
2018-06-20
2018-06-21
2018-06-22
2018-06-25
2018-06-26
2018-06-27
2018-06-28
2018-06-29
2018-07-02
2018-07-03
2018-07-04
2018-07-05
2018-07-06
2018-07-09
2018-07-10
2018-07-11
2018-07-12
2018-07-13
2018-07-16
2018-07-17
2018-07-18
2018-07-19
2018-07-20
2018-07-23
2018-07-24
2018-07-25
2018-07-26
2018-07-27
2018-07-30
2018-07-31
2018-08-01
2018-08-02
2018-08-03
2018-08-06
2018-08-07
2018-08-08
2018-08-09
2018-08-10
2018-08-13
2018-08-14
2018-08-15
2018-08-16
2018-08-17
2018-08-20
2018-08-21
2018-08-22
2018-08-23
2018-08-24
2018-08-27
2018-08-28
2018-08-29
2018-08-30
2018-08-31
2018-09-03
2018-09-04
2018-09-05
2018-09-06
2018-09-07
2018-09-10
2018-09-11
2018-09-12
2018-09-13
2018-09-14
2018-09-17
2018-09-18
2018-09-19
2018-09-20
2018-09-21
2018-09-25
2018-09-26
2018-09-27
2018-09-28
2018-10-08
2018-10-09
2018-10-10
2018-10-11
2018-10-12
2018-10-15
2018-10-16
2018-10-17
2018-10-18
2018-10-19
2018-10-22
2018-10-23
2018-10-24
2018-10-25
2018-10-26
2018-10-29
2018-10-30
2018-10-31
2018-11-01
2018-11-02
2018-11-05
2018-11-06
2018-11-07
2018-11-08
2018-11-09
2018-11-12
2018-11-13
2018-11-14
2018-11-15
2018-11-16
2018-11-19
2018-11-20
2018-11-21
2018-11-22
2018-11-23
2018-11-26
2018-11-27
2018-11-28
2018-11-29
2018-11-30
2018-12-03
2018-12-04
2018-12-05
2018-12-06
2018-12-07
2018-12-10
2018-12-11
2018-12-12
2018-12-13
2018-12-14
2018-12-17
2018-12-18
2018-12-19
2018-12-20
2018-12-21
2018-12-24
2018-12-25
2018-12-26
2018-12-27
2018-12-28
            600675.XSHG  000883.XSHE     ...       300471.XSHE  000533.XSHE
2018-01-30     0.050360     0.018868     ...          0.703896     0.635135
2018-01-31     0.014286     0.018868     ...          0.769437     0.704225
2018-02-01     0.049645     0.142857     ...          0.876106     0.669291
2018-02-02     0.224490     0.214286     ...          0.882105     0.661290
2018-02-05     0.293333     0.259259     ...          0.859296     0.631579

[5 rows x 1000 columns]
# 过去1年效率系数均值

ERmean = df_ER.mean().sort_values(ascending=False)

plt.figure(figsize=(10,5))
plt.bar(range(len(list(ERmean))), list(ERmean),edgecolor='blue')
plt.ylabel('效率系数')
plt.title('过去1年效率系数均值')
plt.show()


print('成分股过去1年效率系数均值的均值:',ERmean.mean())
print('成分股过去1年效率系数均值的中位数:',ERmean.median())
成分股过去1年效率系数均值的均值: 0.27158991677913585
成分股过去1年效率系数均值的中位数: 0.2622299503001218
# 各项统计数据整理存储
storage_hs300 = [market_cap_mean_50,market_cap_std_50,CV_N,money_sort.mean(),close_sort.mean(),close_sort.median(),std_sort.mean(),std_sort.median(),ERmean.mean()]
storage_hs300
[979.8816889999999,
 2070.650186717265,
 0.7524183233636281,
 432044970.9165473,
 23.084255616916007,
 13.703477366255143,
 0.04037518813737779,
 0.038654375282366815,
 0.24236126935609345]
# 各项统计数据整理存储
storage_zz500 = [market_cap_mean_50,market_cap_std_50,CV_N,money_sort.mean(),close_sort.mean(),close_sort.median(),std_sort.mean(),std_sort.median(),ERmean.mean()]
storage_zz500
[124.54847755511022,
 59.822530809772914,
 0.5875640775735343,
 134663688.41165575,
 13.424877448474744,
 9.342263374485599,
 0.04326072387625687,
 0.0425706487208586,
 0.2601572912354841]
# 各项统计数据整理存储
storage_zz1000 = [market_cap_mean_50,market_cap_std_50,CV_N,money_sort.mean(),close_sort.mean(),close_sort.median(),std_sort.mean(),std_sort.median(),ERmean.mean()]
storage_zz1000
[60.9205527,
 33.420999672835535,
 0.6676466131120564,
 87428215.15707137,
 14.702834740847802,
 10.150185185185187,
 0.049612019004642856,
 0.04807667850236288,
 0.27158991677913585]
# 指数成分股相关性

from jqdata import *

import warnings
warnings.filterwarnings('ignore')

# 交易日时间段
start_day = '2015-01-01'
end_day = '2019-04-01'
trade_day_list = get_trade_days(start_date=start_day, end_date=end_day)

corr_list = []
index_list = []

# 每5天计算一次截面相关性
for i in range(0,len(list(trade_day_list)),5):

    each_day = list(trade_day_list)[i]
    index_list.append(each_day)

    q_50 = query(
     valuation.code).filter(
        valuation.code.in_(get_index_stocks('000852.XSHG'))  #中证1000
        # valuation.code.in_(get_index_stocks('000905.XSHG')) #中证500
        # valuation.code.in_(get_index_stocks('000300.XSHG')) #沪深300
    ).order_by(
        valuation.market_cap.desc())
    df_50 = get_fundamentals(q_50, each_day)

    Each_Price_df=get_price(list(df_50.code),end_date=each_day,count=20,fields=['close'],frequency='daily')['close']
    Each_corr = Each_Price_df.corr().mean().mean()
    corr_list.append(Each_corr)

DF_corr_list = pd.DataFrame(index = index_list)
DF_corr_list['corr_list'] = corr_list

DF_corr_list['price_list'] = get_price('000852.XSHG', start_date=start_day, end_date=end_day, \
                                       frequency='1d', fields=['close'])['close']

mpl.rcParams['font.family']='serif'
mpl.rcParams['axes.unicode_minus']=False # 处理负号
(DF_corr_list/DF_corr_list.iloc[0]).plot(figsize=(12,7),grid='on')

print('指数成分股两两间相关系数 = ',DF_corr_list['corr_list'].mean())
指数成分股两两间相关系数 = 0.36256388612173046
# 指数成分股相关性

from jqdata import *

import warnings
warnings.filterwarnings('ignore')

# 交易日时间段
start_day = '2015-01-01'
end_day = '2019-04-01'
trade_day_list = get_trade_days(start_date=start_day, end_date=end_day)

corr_list = []
index_list = []

# 每5天计算一次截面相关性
for i in range(0,len(list(trade_day_list)),5):

    each_day = list(trade_day_list)[i]
    index_list.append(each_day)

    q_50 = query(
     valuation.code).filter(
        # valuation.code.in_(get_index_stocks('000852.XSHG'))  #中证1000
        valuation.code.in_(get_index_stocks('000905.XSHG')) #中证500
        # valuation.code.in_(get_index_stocks('000300.XSHG')) #沪深300
    ).order_by(
        valuation.market_cap.desc())
    df_50 = get_fundamentals(q_50, each_day)

    Each_Price_df=get_price(list(df_50.code),end_date=each_day,count=20,fields=['close'],frequency='daily')['close']
    Each_corr = Each_Price_df.corr().mean().mean()
    corr_list.append(Each_corr)

DF_corr_list = pd.DataFrame(index = index_list)
DF_corr_list['corr_list'] = corr_list

DF_corr_list['price_list'] = get_price('000905.XSHG', start_date=start_day, end_date=end_day, \
                                       frequency='1d', fields=['close'])['close']

mpl.rcParams['font.family']='serif'
mpl.rcParams['axes.unicode_minus']=False # 处理负号
(DF_corr_list/DF_corr_list.iloc[0]).plot(figsize=(12,7),grid='on')

print('指数成分股两两间相关系数 = ',DF_corr_list['corr_list'].mean())
指数成分股两两间相关系数 = 0.36003023746871143
# 指数成分股相关性

from jqdata import *

import warnings
warnings.filterwarnings('ignore')

# 交易日时间段
start_day = '2015-01-01'
end_day = '2019-04-01'
trade_day_list = get_trade_days(start_date=start_day, end_date=end_day)

corr_list = []
index_list = []

# 每5天计算一次截面相关性
for i in range(0,len(list(trade_day_list)),5):

    each_day = list(trade_day_list)[i]
    index_list.append(each_day)

    q_50 = query(
     valuation.code).filter(
        # valuation.code.in_(get_index_stocks('000852.XSHG'))  #中证1000
        # valuation.code.in_(get_index_stocks('000905.XSHG')) #中证500
        valuation.code.in_(get_index_stocks('000300.XSHG')) #沪深300
    ).order_by(
        valuation.market_cap.desc())
    df_50 = get_fundamentals(q_50, each_day)

    Each_Price_df=get_price(list(df_50.code),end_date=each_day,count=20,fields=['close'],frequency='daily')['close']
    Each_corr = Each_Price_df.corr().mean().mean()
    corr_list.append(Each_corr)

DF_corr_list = pd.DataFrame(index = index_list)
DF_corr_list['corr_list'] = corr_list

DF_corr_list['price_list'] = get_price('000300.XSHG', start_date=start_day, end_date=end_day, \
                                       frequency='1d', fields=['close'])['close']

mpl.rcParams['font.family']='serif'
mpl.rcParams['axes.unicode_minus']=False # 处理负号
(DF_corr_list/DF_corr_list.iloc[0]).plot(figsize=(12,7),grid='on')

print('指数成分股两两间相关系数 = ',DF_corr_list['corr_list'].mean())
指数成分股两两间相关系数 = 0.3196961076040989
# 获得三大指数价格,并净值绘图

index_list = ['000852.XSHG','000905.XSHG','000300.XSHG']
Price_df=get_price(index_list,end_date='2019-04-18',count=1000,fields=['close'],frequency='daily')['close']
mpl.rcParams['font.family']='serif'
mpl.rcParams['axes.unicode_minus']=False # 处理负号
(Price_df/Price_df.iloc[0]).plot(figsize=(12,7),grid='on')
/opt/conda/lib/python3.6/site-packages/jqresearch/api.py:87: FutureWarning:
Panel is deprecated and will be removed in a future version.
The recommended way to represent these types of 3-dimensional data are with a MultiIndex on a DataFrame, via the Panel.to_frame() method
Alternatively, you can use the xarray package http://xarray.pydata.org/en/stable/.
Pandas provides a `.to_xarray()` method to help automate this conversion.

  pre_factor_ref_date=_get_today())
/opt/conda/lib/python3.6/site-packages/matplotlib/cbook/__init__.py:424: MatplotlibDeprecationWarning:
Passing one of 'on', 'true', 'off', 'false' as a boolean is deprecated; use an actual boolean (True/False) instead.
  warn_deprecated("2.2", "Passing one of 'on', 'true', 'off', 'false' as a "
<matplotlib.axes._subplots.AxesSubplot at 0x7f490d0be7f0>
# 获得价格的滑动窗标准差,并绘图

import pandas as pd

Price_df_std = Price_df.rolling(window=20).std()

# 同样方法,获得价格均值
mov_close = Price_df.rolling(window=20).mean()

# 将价格归一化后(通过去价格量纲)的动量,装入DataFrame,并赋予时间轴
df_STD = pd.DataFrame(Price_df_std/mov_close)

df_STD = df_STD.dropna()

mpl.rcParams['font.family']='serif'
mpl.rcParams['axes.unicode_minus']=False # 处理负号
df_STD.plot(figsize=(12,7),grid='on')
df_STD.mean()
000852.XSHG    0.034911
000905.XSHG    0.030969
000300.XSHG    0.023826
dtype: float64
# 相关性矩阵绘图

import seaborn as sns
import matplotlib as mpl

fig = plt.figure(figsize= (6,6))
ax = fig.add_subplot(111)
ax = sns.heatmap(Price_df.corr(),\
                 annot=True,annot_kws={'size':12,'weight':'bold'})
# 相关性矩阵绘图

import seaborn as sns
import matplotlib as mpl

fig = plt.figure(figsize= (6,6))
ax = fig.add_subplot(111)
ax = sns.heatmap(df_STD.corr(),\
                 annot=True,annot_kws={'size':12,'weight':'bold'})

本社区仅针对特定人员开放
查看需注册登录并通过风险意识测评
5秒后跳转登录页面...