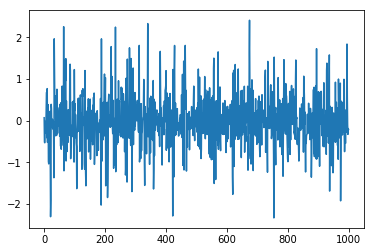
import matplotlib.pyplot as plt
import matplotlib.pyplot as plt
import scipy as sp
sp.random.seed(12345)
n=1000# n is the number of observations
n1=100# we need to drop the first seveal observations
n2=n n1# sum of two numbers
alpha=(0.1,0.3)# GARCH (1,1) coefficients alpha0 and alpha1, see Equation (3)
beta=0.2
errors=sp.random.normal(0,1,n2)
t=sp.zeros(n2)
t[0]=sp.random.normal(0,sp.sqrt(alpha[0]/(1-alpha1)),1)
for i in range(1,n2-1):
t[i]=errors[i]sp.sqrt(alpha[0] alpha1errors[i-1]2 beta*t[i-1]2)
y=t[n1-1:-1]# drop the first n1 observations
x=range(n)
plt.plot(x,y)

[<matplotlib.lines.Line2D at 0x7f7e39a26c18>]