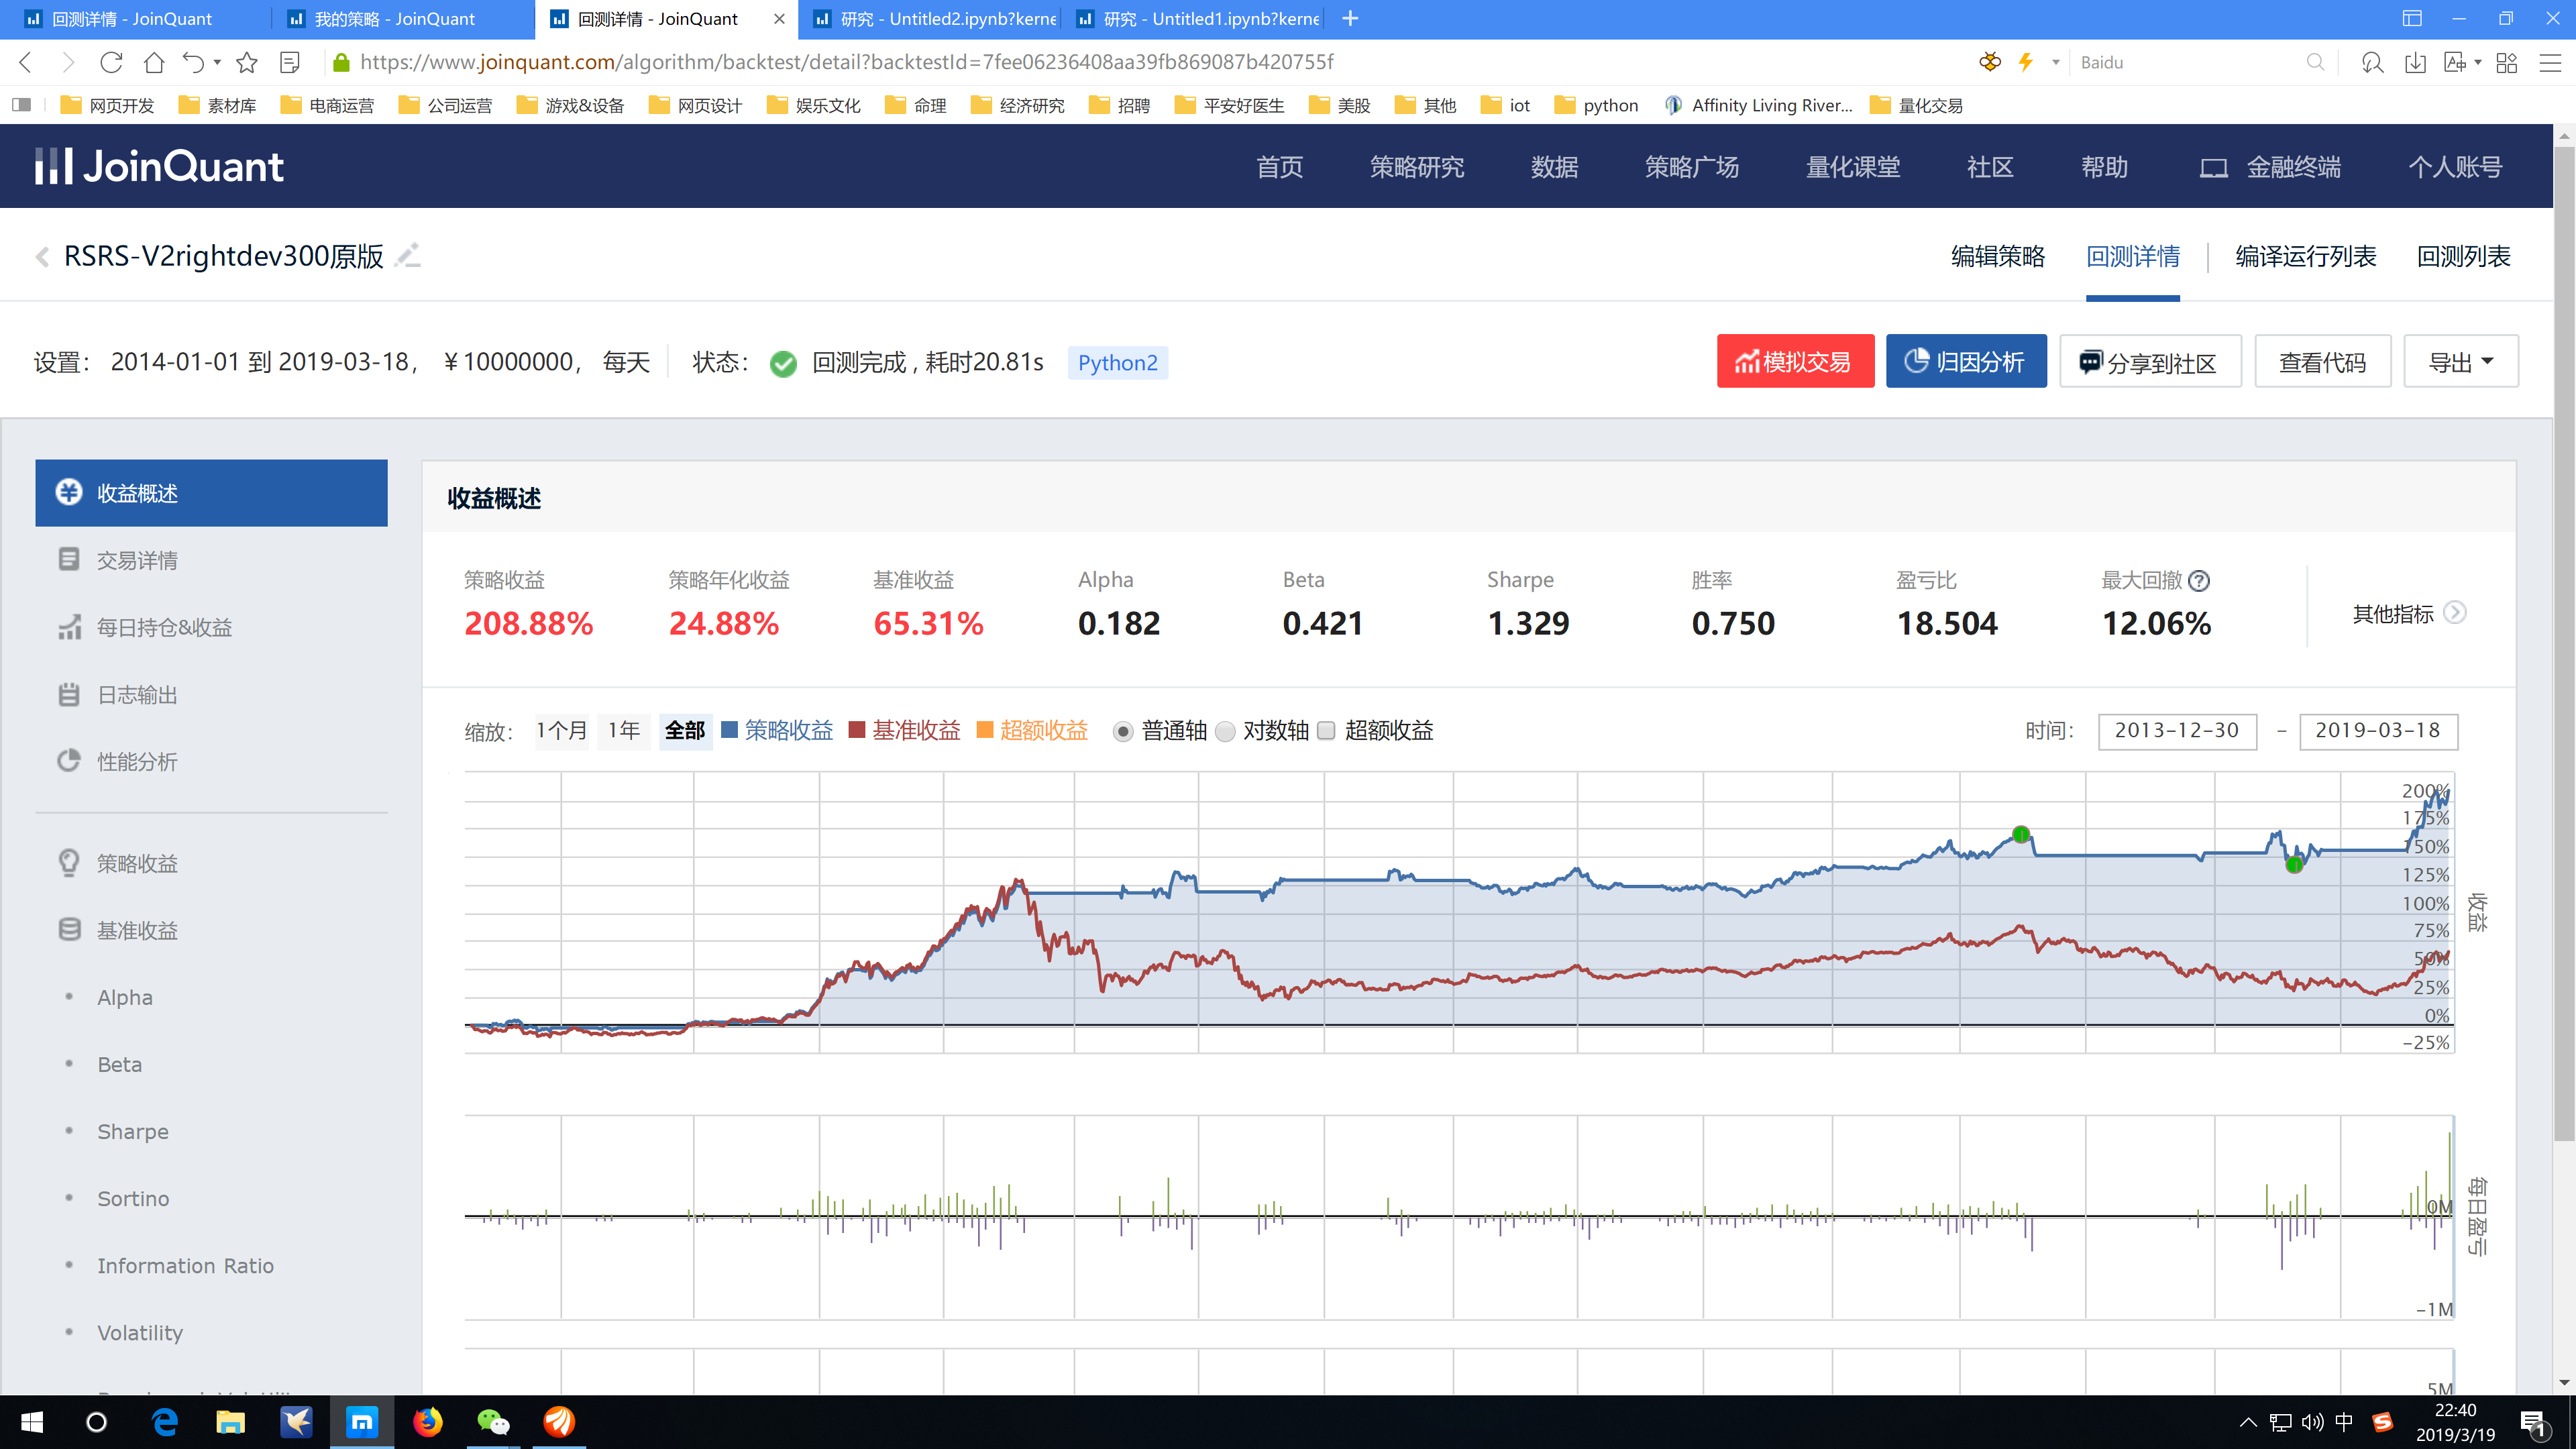
RSRS模型算是近几年比较经典的模型了,我在聚宽原有策略的基础上,以class类的形式精简了代码,并且做了一定优化,其他内容不变。
附图是原版代码的回测,只是代码花了1个小时做了优化,并没有在参数和定义上做其他改动。
我个人对RSRS的择时认为肯定有优化空间,比如加入二八滚动等等,但是老代码只是对HS300进行建模,代码集成度不高,如果滚动的话,效果会比较差,之后会优化代码,以及加入更多择时优化比如我最近在研究的,自己开发的角动量择时。
优化好的模型基本都加了注释,希望可以帮到大家,谢谢!

其实,从数据样本选择上来说,我并不是很喜欢RSRS择时,RSRS择时人为选择了右偏态数据,见下图skew达到了1.17 。
金融学意义上,右偏态的肥尾就代表了收益率
优化上,我们完全可以把buy和sell的0.7进行动态化,也就是
取置信区间的[12,82]中间部分,以达到不同区域,始终保持动态的区间效果,优化版代码我并没有加入这个功能,各位可以根据我附上的研究自行编写。
from sklearn import linear_modelfrom jqdata import *import statsmodels.api as smimport scipy.stats as statsimport numpy as npimport pandas as pdimport mathimport matplotlib.pyplot as pltclass RSRS_CALC:N = 18M = 1100def __init__(self,security,date,N,M) :self.date = dateself.security = securityself.N = Nself.M = Mdef get_prices(self,start_date,count) :security = self.securityend_date = self.dateif count > 0 : prices = attribute_history(security, count, '1d', ['high', 'low'])elif start_date is not None: prices = get_price(security = security, start_date = start_date, end_date = end_date, \ frequency='daily', fields=['high', 'low'])if len(prices.values)>0 :highs = prices.highlows = prices.lowreturn highs,lowselse: passdef calc_OLS_list(self,x,y) : #OLS线性回归X = sm.add_constant(x)model = sm.OLS(y,X)results = model.fit()return resultsdef create_base_record(self,start_date = '2005-01-05'):N = self.Nhighs,lows = self.get_prices(start_date,0)beta_list = []rightdev_list = []for i in range(N,len(highs)):y = highs[i-N:i]x = lows[i-N:i]results = self.calc_OLS_list(x,y)beta_list.append(results.params[1])rightdev_list.append(results.rsquared)return beta_list,rightdev_listdef new_beta_record(self):N = self.Nhighs,lows = self.get_prices(None,N)x = lowsy = highsresults = self.calc_OLS_list(x,y)beta = results.params[1]rightdev=results.rsquaredreturn beta,rightdevdef calc_rscore(self,beta_list,rightdev_list):# 计算标准化的RSRS指标M = self.Mif not (len(beta_list) > 0 or len(rightdev_list) > 0 ):beta_list,rightdev_list = self.create_base_record('2005-01-05')beta,rightdev = self.new_beta_record()beta_list.append(beta)rightdev_list.append(rightdev)section = beta_list[-M:] # 计算均值序列 zscore = stats.zscore(section).tolist()[-1] #序列标准分#计算右偏RSRS标准分zscore_rightdev= zscore*beta*rightdevreturn zscore_rightdevsecurity = '000001.XSHG'N = 18date = datetime.datetime.now() - datetime.timedelta(days=1)rs = RSRS_CALC(security,date,18,1100)beta_list,rightdev_list = rs.create_base_record('2005-01-05')#print rs.new_beta_record()print rs.calc_rscore(beta_list,rightdev_list)#plt.hist(beta_list,bins=50)0.551963274782
DF = pd.DataFrame([beta_list,rightdev_list],index=['beta','rdev']).TDF['zscore'] = DF.beta.apply(lambda x: (x-DF.beta.mean())/DF.beta.std())DF['rscore'] = DF.apply(lambda x: x.beta*x.rdev*x.zscore,axis=1)print DF
          beta      rdev    zscore    rscore
0     0.765083  0.762357 -1.120898 -0.653782
1     0.794287  0.807790 -0.878130 -0.563423
2     0.840015  0.836338 -0.498004 -0.349866
3     0.698184  0.645090 -1.677007 -0.755310
4     0.726553  0.640668 -1.441187 -0.670842
5     0.769735  0.622825 -1.082221 -0.518829
6     0.830108  0.699983 -0.580363 -0.337227
7     0.855516  0.737383 -0.369149 -0.232875
8     0.851725  0.750464 -0.400663 -0.256100
9     0.866546  0.771813 -0.277467 -0.185573
10    0.899543  0.810496 -0.003172 -0.002313
11    0.882656  0.851527 -0.143546 -0.107890
12    0.846255  0.864751 -0.446139 -0.326484
13    0.891465  0.896693 -0.070317 -0.056209
14    0.889193  0.905200 -0.089203 -0.071799
15    0.878066  0.910658 -0.181700 -0.145291
16    0.885322  0.913907 -0.121385 -0.098213
17    0.871379  0.913378 -0.237284 -0.188854
18    0.839568  0.907286 -0.501724 -0.382177
19    0.777681  0.882753 -1.016173 -0.697603
20    0.644092  0.886277 -2.126658 -1.213990
21    0.770415  0.895896 -1.076569 -0.743061
22    0.783835  0.837594 -0.965016 -0.633567
23    0.884549  0.820159 -0.127812 -0.092724
24    0.845566  0.780138 -0.451865 -0.298076
25    0.790113  0.763104 -0.912825 -0.550378
26    0.819636  0.797077 -0.667414 -0.436030
27    0.912117  0.841795  0.101356  0.077823
28    0.916219  0.904901  0.135450  0.112300
29    0.975287  0.925865  0.626465  0.565688
...        ...       ...       ...       ...
3403  0.802709  0.842770 -0.808119 -0.546692
3404  1.045433  0.889722  1.209568  1.125073
3405  1.042320  0.868709  1.183692  1.071801
3406  0.971707  0.860436  0.596712  0.498906
3407  1.066329  0.893351  1.383271  1.317712
3408  1.011117  0.916028  0.924313  0.856109
3409  1.125825  0.929343  1.877843  1.964744
3410  1.035792  0.938179  1.129431  1.097535
3411  1.062039  0.948993  1.347616  1.358219
3412  1.083898  0.960001  1.529318  1.591322
3413  1.079256  0.968833  1.490729  1.558734
3414  1.055139  0.970204  1.290256  1.320835
3415  1.062598  0.975922  1.352260  1.402311
3416  1.097139  0.973328  1.639391  1.750668
3417  1.197086  0.965339  2.470214  2.854563
3418  1.138085  0.971286  1.979762  2.188440
3419  1.127496  0.977275  1.891736  2.084454
3420  1.095680  0.975204  1.627259  1.738745
3421  1.099220  0.976844  1.656686  1.778895
3422  1.101289  0.979616  1.673886  1.805856
3423  1.081550  0.977879  1.509801  1.596804
3424  1.062357  0.977926  1.350260  1.402795
3425  1.052379  0.978224  1.267310  1.304647
3426  1.056061  0.973358  1.297920  1.334165
3427  1.064357  0.971895  1.366882  1.413962
3428  1.045723  0.972495  1.211984  1.232540
3429  1.025941  0.968228  1.047538  1.040566
3430  1.025635  0.961934  1.044999  1.030988
3431  1.004339  0.954159  0.867970  0.831774
3432  0.963998  0.945923  0.532625  0.485684

[3433 rows x 4 columns]
list = DF.rscoreplt.hist(list, bins=50, rwidth=0.5, normed=True)print pd.Series(list).kurt(),pd.Series(list).skew()
3.57447564885 1.17876393794

本社区仅针对特定人员开放
查看需注册登录并通过风险意识测评
5秒后跳转登录页面...
移动端课程
