概述
1. 思路
2. 交易策略
3. 准备测试器指标
3.1. 虚拟交易类
3.2. 指标编程
4. 创建 EA
5. 测试方法
结束语
每次我们在图表上启动智能交易系统时,我们都会面临选择最佳参数以便获得最大盈利能力的问题。 为了找到这些参数,我们会基于历史数据优化交易策略。 然而,如您所知,行情在不断变化。 随着时间的推移,所选参数逐渐失效。
所以,EA 需要重新优化。 这个周期过程持续不断。 每个用户都会自行选择重新优化的时刻。 但是否有可能令该过程自动化? 有哪些可能的解决方案? 也许,您已研究过利用 自定义配置文件 运行终端来对标准策略测试器进行程序化控制的可能性。 我愿意提供一种非常规方法,并将测试器功能分配给一款指标。
当然,指标绝非意指策略测试器。 那么它如何帮助我们优化 EA 呢? 我的思路是在一款指标当中实现 EA 操作的逻辑,并实时跟踪虚拟交易的盈利能力。 在策略测试器中执行优化时,我们会迭代指定参数执行一连串的测试。 类似策略测试器的通关测试,我们将同时启动若干个单一指标的实例,并指派不同的参数值。 当做出决策时,EA 调查所有启动的指标,并从中选择最佳执行参数。
您也许会问,为什么要重新发明轮子。 我们来分析一下这个决策的利弊。 毫无疑问,这种方法的主要优点是在近乎实时的条件下对 EA 进行优化。 第二个优点在于测试是基于您的经纪商的实时逐笔报价。 另一方面,实时测试有一个巨大的缺点,因为您必须要等待收集统计数据。 另一个优点是当行情随时前进时,测试指标只会重新计算当前的逐笔报价而非整个历史记录,而策略测器每次都从历史记录的开头运行。 这种方法可以在适当的时刻提供更快速的优化。 因此,我们几乎可以在每根柱线上进行优化。
这种方法的缺点则包括基于历史数据测试时缺乏逐笔报价。 当然,我们可以利用 CopyTicks 或 CopyTicksRange。 但是下载逐笔报价历史需要时间,且大量数据重新计算也需要计算资源和时间。 我们不要忘记我们用的是指标,在 MetaTrader 5 中单一品种的所有指标共处一个线程中运行。 因此,此处有另一个局限 — 太多指标可能导致终端减速。
为了最大限度地降低所述缺陷的风险,我们做出以下假设:
初始化测试指标时,历史记录按 М1 OHLC 价格计算。 在计算订单盈利/亏损时,首先检查止损,随后按最高价/最低价(取决于订单类型)检查止盈。
根据第 1 点,订单仅在蜡烛开盘时下单。
要减少测试指标的运行总数,请采用有意义的方法来选择其中使用的参数。 您可以在此处根据指标逻辑添加最小步幅和过滤参数。 例如,在使用 MACD 时,如果快速和慢速均线的参数范围重叠,则测试指标排除某一组参数重叠部分的运行,如慢速均线周期小于或等于快速均线周期的部分,这与 EA 操作逻辑相悖。 您还可以在区间内添加最小差值,初期丢弃大量假信号的选项。
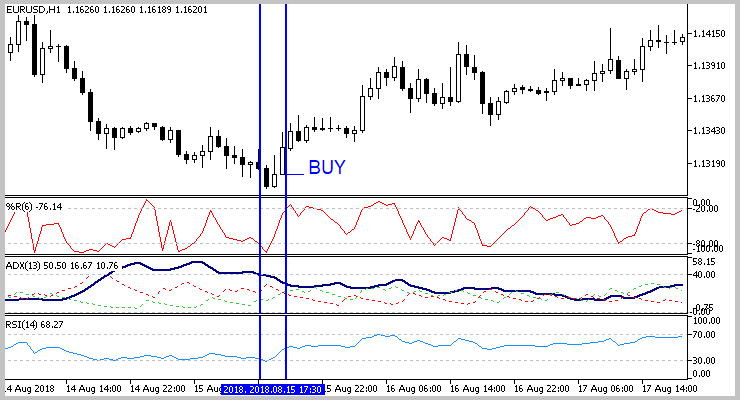
为了测试该方法,我们采用基于三个标准指标 WPR、RSI 和 ADX 的简单策略。 当 WPR 向上超过超卖等级时,触发买入信号(等级 -80)。 RSI 不应处于超买区域(高于等级 70)。 由于两个指标都是振荡器,因此在横盘走势中采用它们是合理的。 ADX 指标检测是否存在横盘,等级不应超过 40。
卖出则是该信号的镜像。 WPR 指标向下超过超买等级 -20,RSI 应超过等级 30 的超卖区域。 ADX 控制横盘的存在,就像买入时一样。
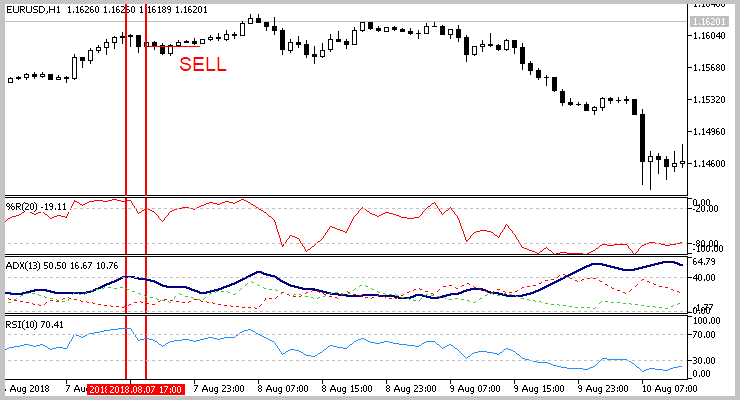
如前所述,出现信号之后在新蜡烛上执行入场。 离场则是通过固定止损或止盈来执行的。
出于亏损管理,同一时刻场内只保留不多于一笔的持仓。
在定义了交易策略之后,是时候开发一个测试指标了。 首先,我们需要准备在指标中跟踪的虚拟订单。 文章 [1] 已经描述了一个虚拟订单类。 我们可以利用这项工作,并补充一些小模块。 前面描述的类具有 Tick 方法,该方法使用当前的竞卖价和竞买价检查平仓的时刻。 此方法仅适用于在实时状态下工作,不适用于基于历史数据检查。 我们略微改动上述函数,在其中添加价格和点差参数。 执行操作后,该方法返回订单状态。 添加后的结果,该方法将得到以下形式。
bool CDeal::Tick(double price, int spread)
  {
   if(d_ClosePrice>0)
      return true;//-   switch(e_Direct)
     {
      case POSITION_TYPE_BUY:
        if(d_SL_Price>0 && d_SL_Price>=price)
          {
           d_ClosePrice=price;
           i_Profit=(int)((d_ClosePrice-d_OpenPrice)/d_Point);
          }
        else          {
           if(d_TP_Price>0 && d_TP_Price<=price)
             {
              d_ClosePrice=price;
              i_Profit=(int)((d_ClosePrice-d_OpenPrice)/d_Point);
             }
          }
        break;
      case POSITION_TYPE_SELL:
        price+=spread*d_Point;
        if(d_SL_Price>0 && d_SL_Price<=price)
          {
           d_ClosePrice=price;
           i_Profit=(int)((d_OpenPrice-d_ClosePrice)/d_Point);
          }
        else          {
           if(d_TP_Price>0 && d_TP_Price>=price)
             {
              d_ClosePrice=price;
              i_Profit=(int)((d_OpenPrice-d_ClosePrice)/d_Point);
             }
          }
        break;
     }
   return IsClosed();
  }
在附件中可找到完整的类代码。
接下来,我们编写指标本身。 由于我们的测试指标以某种方式扮演 EA 的角色,因此其输入将类似于 EA 参数。 首先,设置测试区间,以及指标参数中的止损和止盈价位。 接着,指定应用指标的参数。 最后,指出统计数据的交易方向和平均周期。 有关每个参数的更多使用方法,会在指标代码中用到的地方详述。
input int HistoryDepth = 500; //历史数据深度(柱线)input int StopLoss = 200; //止损(点数)input int TakeProfit = 600; //止盈(点数)//- RSI 指标参数input int RSIPeriod = 28; //RSI 周期input double RSITradeZone = 30; //超买/超卖区域大小//- WPR 指标参数input int WPRPeriod = 7; // WPR 周期input double WPRTradeZone = 30; //超买/超卖区域大小//- ADX 指标参数input int ADXPeriod = 11; //ADX 周期input int ADXLevel = 40; //ADX 横盘等级//-input int Direction = -1; //交易方向 "-1"-所有, "0"-买入, "1"-卖出//-input int *eragePeriod = 10; //均化周期
为了与 EA 进行计算和数据交换,请创建包含以下数据的九个指标缓冲区:
1. 盈利成交的概率。
double Buffer_Probability[];2. 测试期间的盈利因子。
double Buffer_ProfitFactor[];3. 止损和止盈等级。 可以通过创建匹配指标句柄的数组,并在 EA 中指定等级,或者在执行成交时通过其句柄请求指标参数来排除这两个缓冲区。 但是,目前的解决方案对我来说似乎是最简单的解决方案。
double Buffer_TakeProfit[];double Buffer_StopLoss[];
4. 用于计算测试区间内执行的成交总数及其盈利数量的缓冲区。
double Buffer_ProfitCount[];double Buffer_DealsCount[];
5. 以下两个缓冲区用于计算先前的数值,并且仅包含当前柱线的类似数据。
double Buffer_ProfitCountCurrent[];double Buffer_DealsCountCurrent[];
6. 最后但并不仅限于,缓冲区向 EA 发送信号以便执行成交。
double Buffer_TradeSignal[];除了指定的缓冲区外,还声明一个用于存储开仓成交的数组,一个用于记录最后一比成交时间的变量,用于存储指标句柄的变量,以及从全局变量块中的指标获取信息的数组。
CArrayObj Deals;datetime last_deal;int wpr_handle,rsi_handle,adx_handle;double rsi[],adx[],wpr[];
在 OnInit 函数的开头初始化指标。
int OnInit()
  {//- 获取 RSI 指标句柄   rsi_handle=iRSI(Symbol(),PERIOD_CURRENT,RSIPeriod,PRICE_CLOSE);
   if(rsi_handle==INVALID_HANDLE)
     {
      Print("Test Indicator",": Failed to get RSI handle");
      Print("Handle = ",rsi_handle,"  error = ",GetLastError());
      return(INIT_FAILED);
     }//- 获取 WPR 指标句柄   wpr_handle=iWPR(Symbol(),PERIOD_CURRENT,WPRPeriod);

   if(wpr_handle==INVALID_HANDLE)
     {
      Print("Test Indicator",": Failed to get WPR handle");
      Print("Handle = ",wpr_handle,"  error = ",GetLastError());
      return(INIT_FAILED);
     }//- 获取 ADX 指标句柄   adx_handle=iADX(Symbol(),PERIOD_CURRENT,ADXPeriod);
   if(adx_handle==INVALID_HANDLE)
     {
      Print("Test Indicator",": Failed to get ADX handle");
      Print("Handle = ",adx_handle,"  error = ",GetLastError());
      return(INIT_FAILED);
     }
接下来,将指标缓冲区与动态数组关联起来。
//- 指标缓存区映射   SetIndexBuffer(0,Buffer_Probability,INDICATOR_CALCULATIONS);
   SetIndexBuffer(1,Buffer_DealsCount,INDICATOR_CALCULATIONS);
   SetIndexBuffer(2,Buffer_TradeSignal,INDICATOR_CALCULATIONS);
   SetIndexBuffer(3,Buffer_ProfitFactor,INDICATOR_CALCULATIONS);
   SetIndexBuffer(4,Buffer_ProfitCount,INDICATOR_CALCULATIONS);
   SetIndexBuffer(5,Buffer_TakeProfit,INDICATOR_CALCULATIONS);
   SetIndexBuffer(6,Buffer_StopLoss,INDICATOR_CALCULATIONS);
   SetIndexBuffer(7,Buffer_DealsCountCurrent,INDICATOR_CALCULATIONS);
   SetIndexBuffer(8,Buffer_ProfitCountCurrent,INDICATOR_CALCULATIONS);
将时间序列属性分配给所有数组。
   ArraySetAsSeries(Buffer_Probability,true);
   ArraySetAsSeries(Buffer_ProfitFactor,true);
   ArraySetAsSeries(Buffer_TradeSignal,true);
   ArraySetAsSeries(Buffer_DealsCount,true);
   ArraySetAsSeries(Buffer_ProfitCount,true);
   ArraySetAsSeries(Buffer_TakeProfit,true);
   ArraySetAsSeries(Buffer_StopLoss,true);
   ArraySetAsSeries(Buffer_DealsCountCurrent,true);
   ArraySetAsSeries(Buffer_ProfitCountCurrent,true);//-    ArraySetAsSeries(rsi,true);
   ArraySetAsSeries(wpr,true);
   ArraySetAsSeries(adx,true);
在函数结尾处,重置成交数组和最后一笔成交的日期,并将名称分配给我们的指标。
   Deals.Clear();
   last_deal=0;//-   IndicatorSetString(INDICATOR_SHORTNAME,"Test Indicator");//-   return(INIT_SUCCEEDED);
  }
指标的当前数据在 GetIndValue 函数当中下载。 在输入处,指定的函数将接收所需深度的加载历史数据,并且在输出处,该函数将返回已加载元素的数量。 指标的数据存储在全局声明的数组中。
int GetIndValue(int depth)
  {
   if(CopyBuffer(wpr_handle,MAIN_LINE,0,depth,wpr)<=0 || CopyBuffer(adx_handle,MAIN_LINE,0,depth,adx)<=0 || CopyBuffer(rsi_handle,MAIN_LINE,0,depth,rsi)<=0)
      return -1;
   depth=MathMin(ArraySize(rsi),MathMin(ArraySize(wpr),ArraySize(adx)));//-   return depth;
  }
若要检查入场信号,请创建 BuySignal 和 SellSignal 函数。 可从附件中找到函数的代码。
就像任何指标一样,主要功能集中在 OnCalculate 函数当中。 函数操作可以在逻辑上分为两个流程:
重新计算多根柱线时(初始化后第一次启动,或一根新柱线)。 在此流程中,我们将根据 M1 时间帧的历史数据在每根未计算的柱线上检查入场信号,并处理成交持仓的止损单。
在尚未形成新柱时,在每次逐笔报价上检查持仓的止损单的激活情况。
在函数的开头,检查自上次函数启动以来新柱线的数量。 如果这是初始化指标后的首次函数启动,则将指标重新计算的宽度设置为不超过所需的测试深度,并将指标缓冲区置为初始状态。
int OnCalculate(const int rates_total,
                const int prev_calculated,
                const datetime &time[],
                const double &open[],
                const double &high[],
                const double &low[],
                const double &close[],
                const long &tick_volume[],
                const long &volume[],
                const int &spread[])
  {//-   int total=rates_total-prev_calculated;
   if(prev_calculated<=0)
     {
      total=fmin(total,HistoryDepth);//-      ArrayInitialize(Buffer_Probability,0);
      ArrayInitialize(Buffer_ProfitFactor,0);
      ArrayInitialize(Buffer_TradeSignal,0);
      ArrayInitialize(Buffer_DealsCount,0);
      ArrayInitialize(Buffer_ProfitCount,0);
      ArrayInitialize(Buffer_TakeProfit,TakeProfit*_Point);
      ArrayInitialize(Buffer_StopLoss,StopLoss*_Point);
      ArrayInitialize(Buffer_DealsCountCurrent,0);
      ArrayInitialize(Buffer_ProfitCountCurrent,0);
     }
接下来,是新蜡烛开盘时第一个逻辑流程的操作。 首先,下载所采用指标的当前数据。 如果数据下载出现错误,请退出该函数,一直等到下一次逐笔报价再重新计算指标。
   if(total>0)
     {
      total=MathMin(GetIndValue(total+2),rates_total);
      if(total<=0)
         return prev_calculated;
然后将时间序列属性分配到传入的价格数组。
      if(!ArraySetAsSeries(open,true) || !ArraySetAsSeries(high,true) || !ArraySetAsSeries(low,true) || !ArraySetAsSeries(close,true)
         || !ArraySetAsSeries(time,true) || !ArraySetAsSeries(spread,true))
         return prev_calculated;
主循环在随后到来的每根柱线上重新计算。 在循环开始时,初始化指标缓冲区以便重新计算柱线。
      for(int i=total-3;i>=0;i)
        {
         Buffer_TakeProfit[i]=TakeProfit*_Point;
         Buffer_StopLoss[i]=StopLoss*_Point;
         Buffer_DealsCount[i]=Buffer_DealsCountCurrent[i]=0;
         Buffer_ProfitCount[i]=Buffer_ProfitCountCurrent[i]=0;
之后,我们检查一下是否在计算过的柱线上另开了一笔成交。 如果没有,请通过调用以前创建的函数来检查指标的入场信号。 如果存在入场信号,则创建虚拟成交并将相应的信号写入信号缓冲区。
         if(last_deal<time[i])
           {
            if(BuySignal(i))
              {
               double open_price=open[i]+spread[i]*_Point;
               double sl=open_price-StopLoss*_Point;
               double tp=open_price+TakeProfit*_Point;
               CDeal *temp=new CDeal(_Symbol,rates_total-i,POSITION_TYPE_BUY,time[i],open_price,sl,tp);
               if(temp!=NULL)
                  Deals.Add(temp);
               Buffer_TradeSignal[i]=1;
              }
            else /*BuySignal*/            if(SellSignal(i))
              {
               double open_price=open[i];
               double sl=open_price+StopLoss*_Point;
               double tp=open_price-TakeProfit*_Point;
               CDeal *temp=new CDeal(_Symbol,rates_total-i,POSITION_TYPE_SELL,time[i],open_price,sl,tp);
               if(temp!=NULL)
                  Deals.Add(temp);
               Buffer_TradeSignal[i]=-1;
              }
            else /*SellSignal*/               Buffer_TradeSignal[i]=0;
           }
现在,是时候处理持仓了。 首先,检查当前时间帧。 如果指标在 М1 上工作,则通过 OnCalculate 函数参数中获得的时间序列数据检查停止单激活。 否则,我们需要加载分钟时间帧数据。
         if(Deals.Total()>0)
           {
            if(PeriodSeconds()!=60)
              {
               MqlRates rates[];
               int rat=CopyRates(_Symbol,PERIOD_M1,time[i],(i>0 ? time[i-1] : TimeCurrent()),rates);
下载报价后,安排循环以便在每分钟柱线上检查成交持仓的止损单激活情况。 将已平仓且有盈利的成交汇总到相应的指标缓冲区中以便重新计算柱线。 该数组在 CheckDeals 函数中处理。 检查过的蜡烛分钟数据在函数参数中传递。 下面将研究函数的操作算法。
               int closed=0, profit=0;
               for(int r=0;(r<rat && Deals.Total()>0);r++)
                 {
                  CheckDeals(rates[r].open,rates[r].high,rates[r].low,rates[r].close,rates[r].spread,rates[r].time,closed,profit);
                  if(closed>0)
                    {
                     Buffer_DealsCountCurrent[i]+=closed;
                     Buffer_ProfitCountCurrent[i]+=profit;
                    }
                 }
接下来是类似的替代模块。 如果在 M1 时间帧下载分钟报价以及指标操作失败时,会按当前时间帧数据检查成交。
               if(rat<0)
                 {
                  CheckDeals(open[i],high[i],low[i],close[i],spread[i],time[i],closed,profit);
                  Buffer_DealsCountCurrent[i]+=closed;
                  Buffer_ProfitCountCurrent[i]+=profit;
                 }
              }
            else /* PeriodSeconds()!=60 */              {
               int closed=0, profit=0;
               CheckDeals(open[i],high[i],low[i],close[i],spread[i],time[i],closed,profit);
               Buffer_DealsCountCurrent[i]+=closed;
               Buffer_ProfitCountCurrent[i]+=profit;
              }
           } /* Deals.Total()>0 */
最后,我们来分析一下我们的策略操作统计数据。 计算测试区间内开立的成交数量,以及有多少笔成交盈利了结。
         Buffer_DealsCount[i+1]=NormalizeDouble(Buffer_DealsCount[i+2]+Buffer_DealsCountCurrent[i+1]-((i+HistoryDepth+1)<rates_total ? Buffer_DealsCountCurrent[i+HistoryDepth+1] : 0),0);
         Buffer_ProfitCount[i+1]=NormalizeDouble(Buffer_ProfitCount[i+2]+Buffer_ProfitCountCurrent[i+1]-((i+HistoryDepth+1)<rates_total ? Buffer_ProfitCountCurrent[i+HistoryDepth+1] : 0),0);
         Buffer_DealsCount[i]=NormalizeDouble(Buffer_DealsCount[i+1]+Buffer_DealsCountCurrent[i]-((i+HistoryDepth)<rates_total ? Buffer_DealsCountCurrent[i+HistoryDepth] : 0),0);
         Buffer_ProfitCount[i]=NormalizeDouble(Buffer_ProfitCount[i+1]+Buffer_ProfitCountCurrent[i]-((i+HistoryDepth)<rates_total ? Buffer_ProfitCountCurrent[i+HistoryDepth] : 0),0);
如果存在已激活的成交,则计算盈利成交的概率以及在测试期间内的策略盈利因子。 为了避免获利概率的突然变化,将按照指标参数中设置的平均周期,采用指数平均方程对该参数进行平滑。
         if(Buffer_DealsCount[i]>0)
           {
            double pr=2.0/(*eragePeriod-1.0);
            Buffer_Probability[i]=((i+1)<rates_total && Buffer_Probability[i+1]>0 && Buffer_DealsCount[i+1]>=*eragePeriod ? Buffer_ProfitCount[i]/Buffer_DealsCount[i]*100*pr+Buffer_Probability[i+1]*(1-pr) : Buffer_ProfitCount[i]/Buffer_DealsCount[i]*100);
            if(Buffer_DealsCount[i]>Buffer_ProfitCount[i])
              {
               double temp=(Buffer_ProfitCount[i]*TakeProfit)/(StopLoss*(Buffer_DealsCount[i]-Buffer_ProfitCount[i]));
               Buffer_ProfitFactor[i]=((i+1)<rates_total && Buffer_ProfitFactor[i+1]>0 ? temp*pr+Buffer_ProfitFactor[i+1]*(1-pr) : temp);
              }
            else               Buffer_ProfitFactor[i]=TakeProfit*Buffer_ProfitCount[i];
           }
        }
     }
处理每次逐笔报价的流程包含类似的逻辑,因此没必要在此提供其完整描述。 可在附件中查找所有指标函数的完整代码。
以前,我已经提到在 CheckDeals 函数中执行检查持仓的止损单激活状态。 我们来研究一下它的操作算法。 在参数中,函数获得所分析柱线的报价,以及指向要返回的已平仓和盈利成交数量的两个变量链接。
在函数伊始,我们重置返回的变量并声明逻辑变量的结果。
bool CheckDeals(double open,double high,double low,double close,int spread,datetime time,int &closed, int &profit)
  {
   closed=0;
   profit=0;
   bool result=true;
进而,在函数中安排所有成交数组的迭代循环。 在循环中逐个获得指向成交对象的指针。 如果指向对象的指针错误,则从数组中删除此成交并继续处理下一笔成交。 如果操作执行时出错,则将结果变量设置为 'false'。
   for(int i=0;i<Deals.Total();i++)
     {
      CDeal *deal=Deals.At(i);
      if(CheckPointer(deal)==POINTER_INVALID)
        {
         if(Deals.Delete(i))
            i;
         else            result=false;
         continue;
        }
接下来,检查蜡烛开盘时是否有成交。 如果没有,继续下一笔成交。
      if(deal.GetTime()>time)
         continue;
最后,持续调用 Tick 方法检查交易,基于每次价格的开盘价,最高价,最低价和收盘价检查成交止损单的激活情况。 该方法的算法已在 当前章节的开头 描述过。 请记住,买入和卖出成交的检查顺序是不同的。 首先,检查止损激活,然后止盈。 这种方法也许在某种程度上低估了交易结果,但它减少了未来交易中的损失。 当触发任何止损订单时,平仓成交的数量增加,并且在获利的情况下,盈利成交的数量也会增加。 成交了结后,将从数组中剔除,以避免重新计算。
      if(deal.Tick(open,spread))
        {
         closed++;
         if(deal.GetProfit()>0)
            profit++;
         if(Deals.Delete(i))
            i;
         if(CheckPointer(deal)!=POINTER_INVALID)
            delete deal;
         continue;
        }
      switch(deal.Type())
        {
         case POSITION_TYPE_BUY:
            if(deal.Tick(low,spread))
              {
               closed++;
               if(deal.GetProfit()>0)
                  profit++;
               if(Deals.Delete(i))
                  i;
               if(CheckPointer(deal)!=POINTER_INVALID)
                  delete deal;
               continue;
              }
            if(deal.Tick(high,spread))
              {
               closed++;
               if(deal.GetProfit()>0)
                  profit++;
               if(Deals.Delete(i))
                  i;
               if(CheckPointer(deal)!=POINTER_INVALID)
                  delete deal;
               continue;
              }
           break;
         case POSITION_TYPE_SELL:
            if(deal.Tick(high,spread))
              {
               closed++;
               if(deal.GetProfit()>0)
                  profit++;
               if(Deals.Delete(i))
                  i;
               if(CheckPointer(deal)!=POINTER_INVALID)
                  delete deal;
               continue;
              }
            if(deal.Tick(low,spread))
              {
               closed++;
               if(deal.GetProfit()>0)
                  profit++;
               if(Deals.Delete(i))
                  i;
               if(CheckPointer(deal)!=POINTER_INVALID)
                  delete deal;
               continue;
              }
           break;
        }
     }//-   return result;
  }
附件中提供了指标及其所有函数的完整代码。
创建测试指标后,现在是时候开发我们的 EA 了。 在 EA 参数中,我们设置静态变量的数量(所有通关测试共用),并且类似于策略测试器,定义可变化参数的初始值和结束值,以及数值变更的步幅。 此外,在 EA 参数中,我们还指定了选择入场信号的标准 — 获利的最小概率和测试期间的最小盈利因子。 此外,为了维护所获统计数据的客观性,我们要指明测试期间所需的最低成交数量。
input double Lot = 0.01;input int HistoryDepth = 500; //历史数据深度(柱线)//- RSI 指标参数input int RSIPeriod_Start = 5; //RSI 周期input int RSIPeriod_Stop = 30; //RSI 周期input int RSIPeriod_Step = 5; //RSI 周期//-input double RSITradeZone_Start = 30; //起始超买/超卖区域大小input double RSITradeZone_Stop = 30; //结束超买/超卖区域大小input double RSITradeZone_Step = 5; //超买/超卖区域大小步幅//- WPR 指标参数input int WPRPeriod_Start = 5; //WPR 起始周期input int WPRPeriod_Stop = 30; //WPR 结束周期input int WPRPeriod_Step = 5; //WPR 周期步幅//-input double WPRTradeZone_Start = 20; //超买/超卖区域大小起始input double WPRTradeZone_Stop = 20; //超买/超卖区域大小结束input double WPRTradeZone_Step = 5; //超买/超卖区域大小步幅//- ADX 指标参数input int ADXPeriod_Start = 5; //ADX 周期起始input int ADXPeriod_Stop = 30; //ADX 周期结束input int ADXPeriod_Step = 5; //ADX 周期步幅//-input int ADXTradeZone_Start = 40; //横盘等级 ADX 起始input int ADXTradeZone_Stop = 40; //横盘等级 ADX 结束input int ADXTradeZone_Step = 10; //横盘等级 ADX 步幅//- 成交设置input int TakeProfit_Start = 600; //止盈起始input int TakeProfit_Stop = 600; //止盈结束input int TakeProfit_Step = 100; //止盈步幅//-input int StopLoss_Start = 200; //止损起始input int StopLoss_Stop = 200; //止损结束input int StopLoss_Step = 100; //止损步幅//-input double MinProbability = 60.0; //Minimal Probabilityinput double MinProfitFactor = 1.6; //Minimal Profitfactorinput int MinOrders = 10; //历史当中最少成交数量
在全局变量中,声明交易操作类的实例,以及存储测试指标句柄的数组。
CArrayInt   ar_Handles;
CTrade      Trade;
在 EA 的 OnInit 函数当中,分派一系列嵌套循环,用于迭代测试参数的所有选项,并添加单独的买卖成交测试。 这种方法可以检测到测试策略器未能跟踪的全局趋势影响。 测试指标在循环内初始化。 如果指标下载失败,退出函数,并返回 INIT_FAILED 结果。 如果指标成功加载,则将其句柄添加到数组中。
int OnInit()
  {//-   for(int rsi=RSIPeriod_Start;rsi<=RSIPeriod_Stop;rsi+=RSIPeriod_Step)
      for(double rsi_tz=RSITradeZone_Start;rsi_tz<=RSITradeZone_Stop;rsi_tz+=RSITradeZone_Step)
         for(int wpr=WPRPeriod_Start;wpr<=WPRPeriod_Stop;wpr+=WPRPeriod_Step)
            for(double wpr_tz=WPRTradeZone_Start;wpr_tz<=WPRTradeZone_Stop;wpr_tz+=WPRTradeZone_Step)
               for(int adx=ADXPeriod_Start;adx<=ADXPeriod_Stop;adx+=ADXPeriod_Step)
                  for(double adx_tz=ADXTradeZone_Start;adx_tz<=ADXTradeZone_Stop;adx_tz+=ADXTradeZone_Step)
                     for(int tp=TakeProfit_Start;tp<=TakeProfit_Stop;tp+=TakeProfit_Step)
                        for(int sl=StopLoss_Start;sl<=StopLoss_Stop;sl+=StopLoss_Step)
                          for(int dir=0;dir<2;dir++)
                             {
                              int handle=iCustom(_Symbol,PERIOD_CURRENT,"::Indicators\\TestIndicator\\TestIndicator.ex5",HistoryDepth,
                                                                                                                        sl,
                                                                                                                        tp,
                                                                                                                        rsi,
                                                                                                                        rsi_tz,
                                                                                                                        wpr,
                                                                                                                        wpr_tz,
                                                                                                                        adx,
                                                                                                                        adx_tz,
                                                                                                                        dir);
                              if(handle==INVALID_HANDLE)
                                 return INIT_FAILED;
                              ar_Handles.Add(handle);
                             }
成功启动所有测试指标后,初始化交易操作类并完成函数执行。
   Trade.SetAsyncMode(false);
   if(!Trade.SetTypeFillingBySymbol(_Symbol))
      return INIT_FAILED;
   Trade.SetMarginMode();//-   return(INIT_SUCCEEDED);
  }
交易信号经过整理并在 OnTick 函数中执行交易操作。 由于我们之前决定仅在柱线开盘时开仓,那么我们应在函数开始时检查此事件的发生。
void OnTick()
  {//-   static datetime last_bar=0;
   datetime cur_bar=(datetime)SeriesInfoInteger(_Symbol,PERIOD_CURRENT,SERIES_LASTBAR_DATE);
   if(cur_bar==last_bar)
      return;
我们的第二个限制是一次不超过一笔成交。 因此,如果已有持仓,则终止函数执行。
   if(PositionSelect(_Symbol))
     {
      last_bar=cur_bar;
      return;
     }
检查控制点后,进入主循环,迭代所有指标搜索信号。 在循环开始时,我们尝试加载指标的信号缓冲区。 如果指标尚未重新计算或没有交易信号,则继续处理下一个指标。
   int signal=0;
   double probability=0;
   double profit_factor=0;
   double tp=0,sl=0;
   bool ind_caclulated=false;
   double temp[];
   for(int i=0;i<ar_Handles.Total();i++)
     {
      if(CopyBuffer(ar_Handles.At(i),2,1,1,temp)<=0)
         continue;
      ind_caclulated=true;
      if(temp[0]==0)
         continue;
下一步是检查所接收信号是否与先前从其它指标接收到的信号相矛盾。 存在冲突信号会增加出错的概率,因此我们在下一根蜡烛开始形成之前退出该函数。
      if(signal!=0 && temp[0]!=signal)
        {
         last_bar=cur_bar;
         return;
        }
      signal=(int)temp[0];
然后,检查测试期间内是否存在最低要求的成交数量。 如果样品不足,则转到下一个指标。
      if(CopyBuffer(ar_Handles.At(i),1,1,1,temp)<=0 || temp[0]<MinOrders)
         continue;
进而,以类似的方式验证盈利成交概率的充分性。
      if(CopyBuffer(ar_Handles.At(i),0,1,1,temp)<=0 || temp[0]<MathMax(probability,MinProbability))
         continue;
如果所分析指标显示盈利成交的概率与先前检查指标的差值小于 1%,则根据盈利因子和盈利/风险比率从两次通关测试中选择最佳的一个。 保存最佳通关测试数据,以便进一步的操作。
      if(MathAbs(temp[0]-probability)<=1)
        {
         double ind_probability=temp[0];//-         if(CopyBuffer(ar_Handles.At(i),3,1,1,temp)<=0 || temp[0]<MathMax(profit_factor,MinProfitFactor))
            continue;
         double ind_profit_factor=temp[0];
         if(CopyBuffer(ar_Handles.At(i),5,1,1,temp)<=0)
            continue;
         double ind_tp=temp[0];
         if(CopyBuffer(ar_Handles.At(i),6,1,1,temp)<=0)
            continue;
         double ind_sl=temp[0];
         if(MathAbs(ind_profit_factor-profit_factor)<=0.01)
           {
            if(sl<=0 || tp/sl>=ind_tp/ind_sl)
               continue;
           }//-         probability=ind_probability;
         profit_factor=ind_profit_factor;
         tp=ind_tp;
         sl=ind_sl;
        }
如果获利成交的概率明显更高,则检查通关测试的盈利因子需求。 如果满足所有需求,则保存通关测试数据以便进一步的操作。
      else /* MathAbs(temp[0]-probability)<=1 */        {
         double ind_probability=temp[0];//-         if(CopyBuffer(ar_Handles.At(i),3,1,1,temp)<=0 || temp[0]<MinProfitFactor)
            continue;
         double ind_profit_factor=temp[0];
         if(CopyBuffer(ar_Handles.At(i),5,1,1,temp)<=0)
            continue;
         double ind_tp=temp[0];
         if(CopyBuffer(ar_Handles.At(i),6,1,1,temp)<=0)
            continue;
         double ind_sl=temp[0];
         probability=ind_probability;
         profit_factor=ind_profit_factor;
         tp=ind_tp;
         sl=ind_sl;
        }
     }
如果在检查完所有测试指标后没有任何单个测试指标重新计算过,则退出该函数,一直等到下一次逐笔报价再重新计算指标。
   if(!ind_caclulated)
      return;
成功检查全部指标,且无有效交易信号后,在新柱线形成之前退出该函数。
   last_bar=cur_bar;//-   if(signal==0 || probability==0 || profit_factor==0 || tp<=0 || sl<=0)
      return;
在函数结束时,如果有入场信号,则根据最佳通关测试参数发送订单。
   if(signal==1)
     {
      double price=SymbolInfoDouble(_Symbol,SYMBOL_ASK);
      tp+=price;
      sl=price-sl;
      Trade.Buy(Lot,_Symbol,price,sl,tp,"Real Time Optimizator");
     }
   else      if(signal==-1)
        {
         double price=SymbolInfoDouble(_Symbol,SYMBOL_BID);
         tp=price-tp;
         sl+=price;
         Trade.Sell(Lot,_Symbol,price,sl,tp,"Real Time Optimizator");
        }
  }
在附件中可找到完整的 EA 代码。
为了展示该方法,按照测试 EA 的设置,将标准 EA 的可调参数设置为相似范围并保持同样的测试时间区域,以前瞻模式运行优化测试。 为了保持条件相同,我们创建的 EA 只启动一个测试指标,并在所有信号出现时开仓,而不用过滤统计数据。 其构造结构类似于上面创建的 EA,但信号一致性过滤模块除外。 完整的 EA 代码可在附件中找到(ClassicExpert.mq5)。
测试时间帧为 H1,2018 年,为期 7 个月。 测试区间的 1/3 用于标准 EA 的前瞻测试。
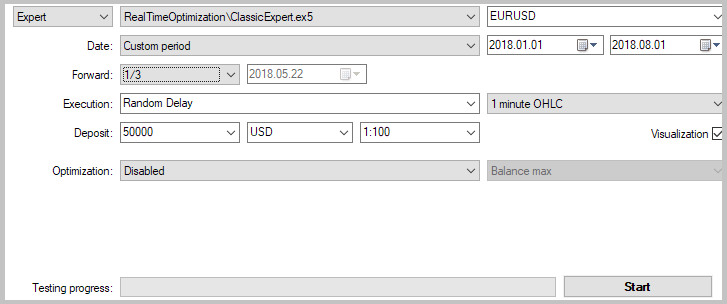
选择指标计算周期作为优化参数。 所有指标均使用 5 到 30 的单一数值范围,步长为 5。
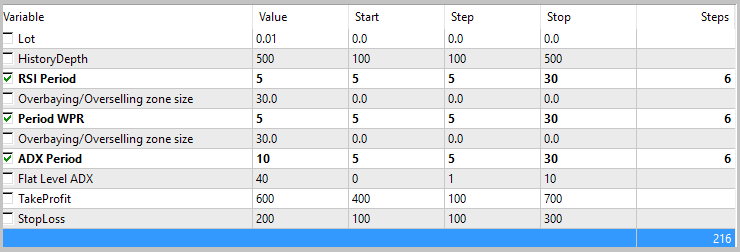
该策略优化结果前后表现不一致。 在优化过程中表现出薄利的参数值在前瞻测试期间转为亏损。 总体上,没有一个通关测试参数在分析区间内表现出获利。
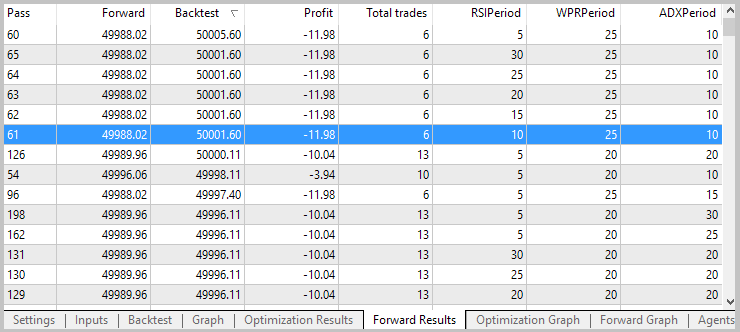
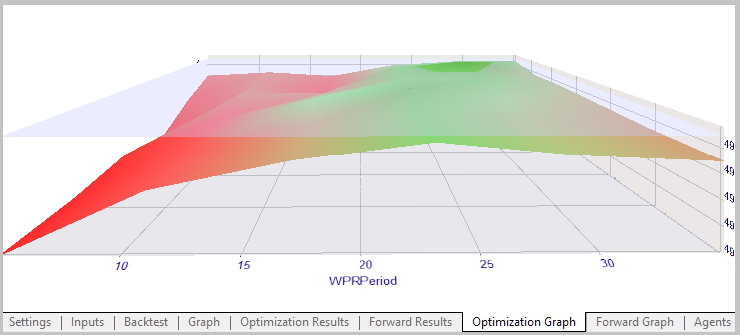
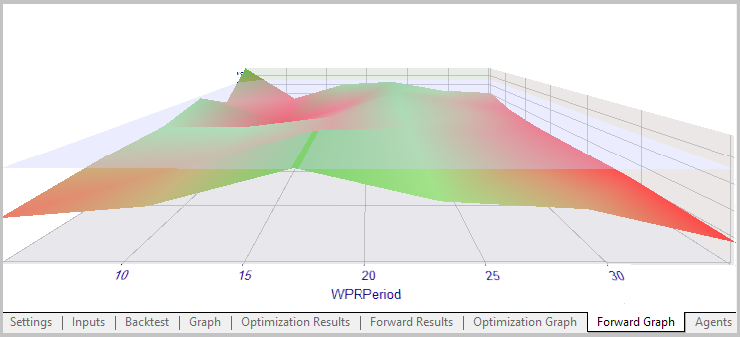
优化和前瞻测试的图形分析结果表明,价格走势的结构发生变化,导致盈利区域在 WPR 指标周期内偏移。
为了测试根据提议方法开发出的 EA,我们指定了类似的测试参数,同时保持相同的分析周期。 为了理清入场信号,我们指定最小盈利成交概率等于 60%,测试期间的最小盈利因子等于 2。 测试深度为 500 根蜡烛。
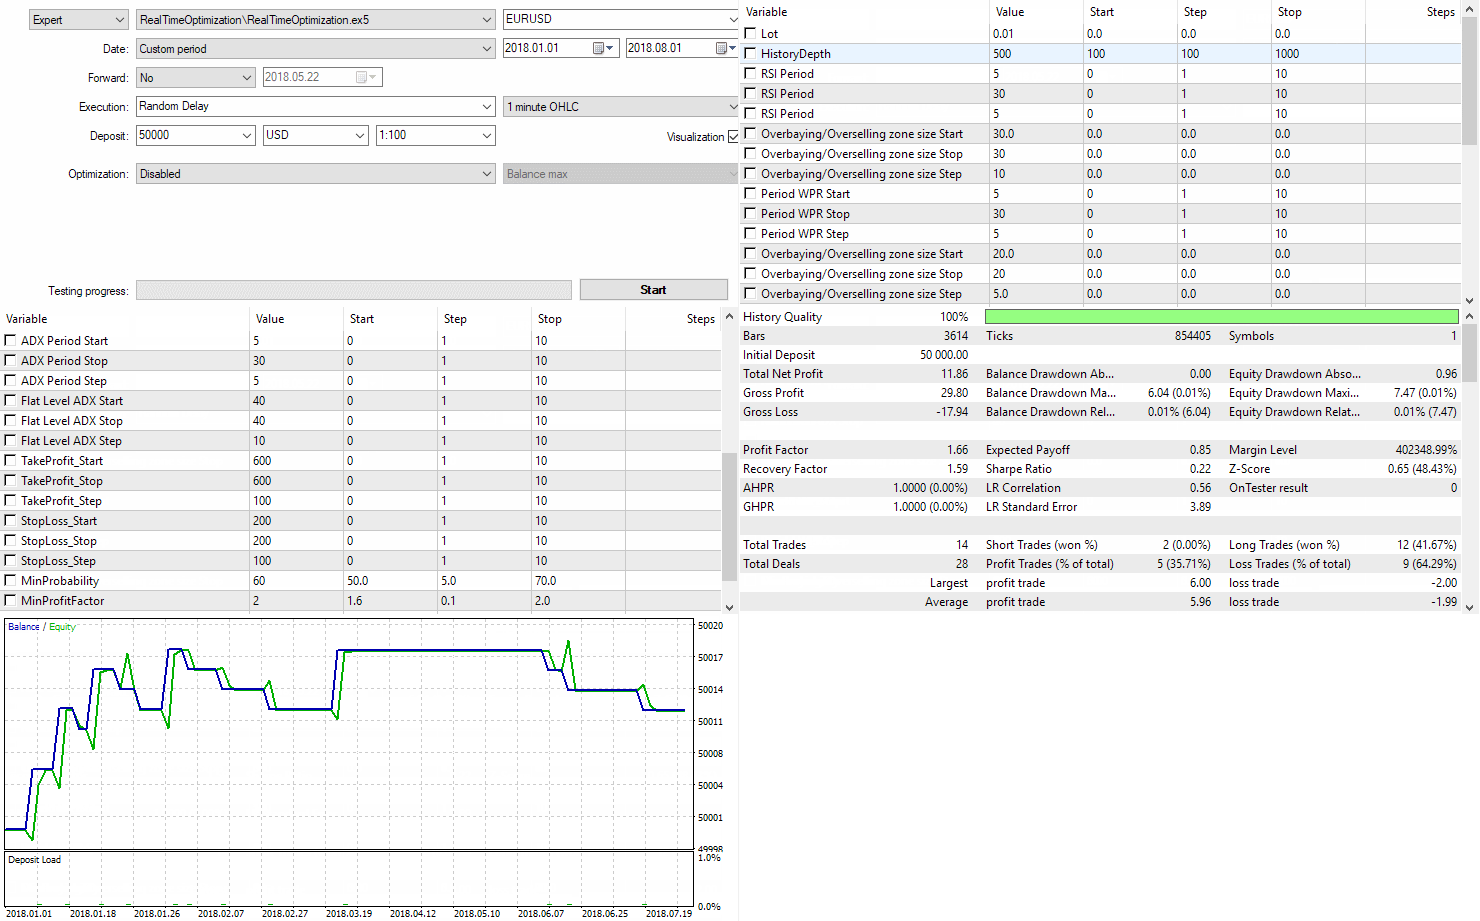
在测试期间,EA 在分析期内显示盈利,实际盈利因子为 1.66。 在可视测试模式期间,测试代理占用了 1250 MB 的内存。
本文提出了开发实时优化 EA 的方法。 测试已展现出真实交易中方法的可行性。 基于所提议方法的 EA 已证明,策略盈利期间获得的参数很可能会失效并导致亏损。 同时,该方法在计算资源方面要求很高。 CPU 速度应该能够重新计算所有加载的指标,而内存应该包含所有应用的指标。
运用解析入场为指标的技术创建新的交易策略
| # | 名称 | 类型 | 描述 |
|---|---|---|---|
| 1 | Deal.mqh | 类库 | 虚拟交易类 |
| 2 | TestIndicator.mq5 | 指标 | 测试指标 |
| 3 | RealTimeOptimization.mq5 | 智能交易系统 | 基于提议方法的 EA |
| 4 | ClassicExpert.mq5 | 智能交易系统 | 基于标准方法的 EA,用于优化比较 |

本社区仅针对特定人员开放
查看需注册登录并通过风险意识测评
5秒后跳转登录页面...
移动端课程
