本文主要讲述使用 EViews 软件对 EURUSD 的先行预测以及使用 EViews 语言程序和在 MQL4 中开发的 Expert Advisor 对预测结果进行的进一步评估。 上述内容建立在文章“分析指标统计参数”的基础之上,我们在使用此文章的论点时将不做补充说明。
上一篇文章中,我们用以下回归方程的分析作为结尾:
EURUSD = C(1)*EURUSD_HP(1) + C(2)*D(EURUSD_HP(1)) + C(3)*D(EURUSD_HP(2))
此方程是将初始收盘价报价逐步分解所产生的结果。 其背后的思路是将确定性成分从初始报价中分离以及对残余成分的进一步分析。
让我们开始构建一个针对从 2011 年 9 月 12 日到 2011 年 9 月 17 日这一周时间内的条柱上的 EURUSD H1 的模型。
1.1. 初始 EURUSD 报价的分析
让我们先分析初始 EURUSD 系列,以便对下一步进行规划。
首先,让我们创建一个文件,其中包含要在 EViews 中进行进一步分析的报价。 为此,我使用一个叠加于相关图表上的指标来生成带报价的必要文件。
此指标的脚本如下所示,个人认为不需要添加注释。
//+------------------------------------------------------------------+
//|                                                   Kotir_Out.mq4  |
//|   Quotes output indicator for EViews                             |
//|   Version of 29.08.2011                                          |
//+------------------------------------------------------------------+
//--- indicator in the main window
#property indicator_chart_window
//--- number of visible indicator buffers
#property indicator_buffers            1
//--- setting the indicator color
#property indicator_color1             Red      // Forecast
//--- setting the line width
#property indicator_width1             2
//--- external parameters
extern   int      Number_Bars=100;     // Number of bars
extern   string   DateTime_begin    =  "2011.01.01 00:00";
extern   string   DateTime_end      =  "2011.01.01 00:00";
//--- global variables
//--- declaring buffers
double   Quotes[];         // Quotes not visible
int      Quotes_handle;    // Pointer to Quotes file
int      i;                // Counter in cycle
//--- names of files for exchange with EViews
string   fileQuotes;       // Quotes file name
//+------------------------------------------------------------------+
//|Indicator initialization function                                 |
//+------------------------------------------------------------------+
int init()
  {
//--- number of indicator buffers
   IndicatorBuffers(1);
//--- setting the drawing parameters
   SetIndexStyle(0,DRAW_LINE,STYLE_SOLID,0);
   SetIndexDrawBegin(0,Number_Bars);

//--- binding the indicator number to the name
   SetIndexBuffer(0,Quotes);  // Index buffer

//--- initial buffer values
   SetIndexEmptyValue(0,0.0);
//--- indicator name
   IndicatorShortName("Forecast");
//--- generating names of files for exchange with EViews
   fileQuotes="kotir.txt";   // Quotes file name
   int       N_bars_begin   =  0;
   int       N_bars_end     =  0;

   datetime  var_DT_begin   =  0;
   datetime  var_DT_end     =  0;
   bool      exact          =  false;
//---
//--- creating quotes file for EViews operation
   Quotes_handle=FileOpen(fileQuotes,FILE_CSV|FILE_WRITE,',');
//--- abend exit
   if(Quotes_handle<1)
     {
      Print("Failed to create the file ",fileQuotes," Error #",GetLastError());
      return(0);
     }
   FileWrite(Quotes_handle,"DATE","kotir");  // Header
//---
//--- calculating the number of bars for export
   var_DT_begin =  StrToTime(DateTime_begin);
   var_DT_end   =  StrToTime(DateTime_end);

   if(var_DT_begin!=var_DT_end)
     {
      N_bars_begin=iBarShift(NULL,Period(),var_DT_begin,exact);
      N_bars_end=iBarShift(NULL,Period(),var_DT_end,exact);
      Number_Bars=N_bars_begin-N_bars_end;

      Print("Number_Bars = ",Number_Bars,
            ", N_bars_end = ",N_bars_end,
            ", N_bars_begin = ",N_bars_begin);

      for(i=N_bars_begin; i>=N_bars_end; i--)
        {
         FileWrite(Quotes_handle,
                   TimeToStr(iTime(Symbol(),Period(),i)),
                   iOpen(Symbol(),Period(),i));
        }
     }
   else
     {
      for(i=Number_Bars-1; i>=0; i--)
        {
         FileWrite(Quotes_handle,
                   TimeToStr(iTime(Symbol(),Period(),i)),
                   iOpen(Symbol(),Period(),i));
        }
     }
// --- writing quotes
   FileWrite(Quotes_handle, "Forecast ", 0);   // Forecast area
   FileClose(Quotes_handle);                  // Close quotes file
   Comment("Created quotes file with the number of bars =",Number_Bars+1);
//--- end of Init() section
   return(0);
  }
//+------------------------------------------------------------------+
//| Indicator start function                                         |
//+------------------------------------------------------------------+
int start()
  {
   return(0);
  }
//+------------------------------------------------------------------+
//| Custom indicator deinitialization function                       |
//+------------------------------------------------------------------+
int deinit()
  {
//--- remove the message from the display
   Comment("                                                     ");
//----
   return(0);
  }
//+------------------------------------------------------------------+
设置上述指定的日期后,我获得了包含 119 行的报价文件,最后一行是“Forecast,0” вЂ,指示未来预测的位置。 记住,我使用的是 开盘 价。 还要注意,文件中的报价顺序与 MQL4 的报价顺序相反,即使用编程语言中的顺序。
很明显,指标在终端文件夹 \expert\files\ 中生成了文件 quotes.txt。 以下将要查看的 Expert Advisor 在 DEMO 或 REAL 模式下工作时,将采用指定文件夹中的报价文件;但在测试模式下使用时,此文件应位于 \tester\files\ folder,因此我将 quotes.txt 手动放在 \tester\files\ 终端文件夹内。
图表如下:
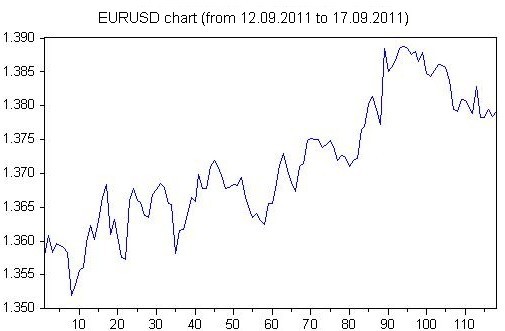
图 1 EURUSD H1 报价图表
我们可以观察一个或无数个趋势,但我们的目标是预测交易系统未来的稳定性。 因此我们将分析初始 EURUSD H1 报价的稳定性。
让我们计算描述性统计:
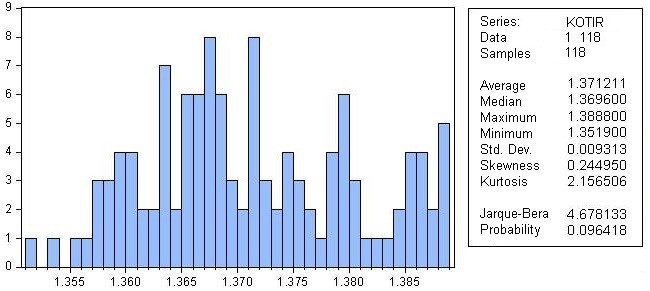
图 2 描述性统计
描述性统计表明:
外表看来,直方图显然与正态分布没有任何关系,但 9.64% 的概率引发了某些幻想。
让我们对比理论情况进行证明:
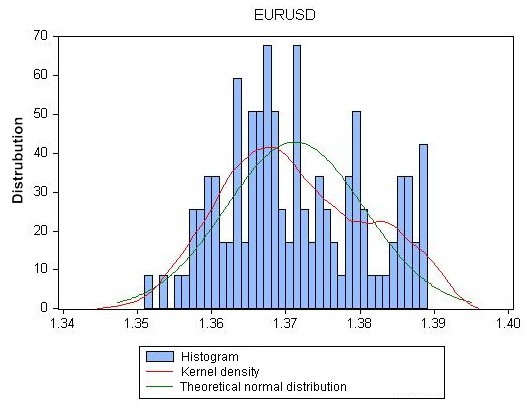
图 3 EURUSD 直方图与理论正态分布曲线的对比
我们可以直观地确定 EURUSD_Рќ1 报价远非正态分布。
但是,现在下结论仍然为时过早,因为我们可以看到这个趋势表明报价中存在决定性成分,而此类成分的存在会完全扭曲随机变量(报价)的统计特征。
让我们计算报价的自相关函数。
它显示如下:
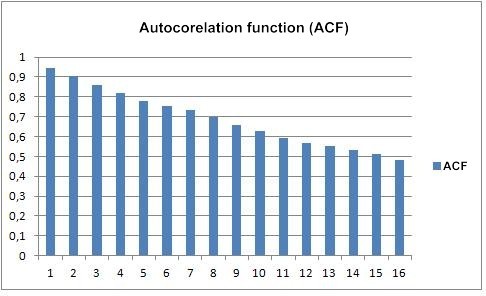
图 4 EURUSD_H1 报价的自相关函数
绘制图表时,我们已经获得了延迟之间缺乏关联的概率 - 对于前 16 个延迟来说不是 0。 图表和概率清楚地表明,EURUSD_H1 中的延迟之间存在关联,即相关报价包含确定性成分。
如果从初始报价中扣除确定性成分,那么残余部分会拥有什么统计特征?
为此,我们将应用单位根检验,看使用初始报价的一阶差分(残余)是否更有前景。

表 1 单位根检验:
上述检验表明:
1.2. 平滑处理
将通过与上一篇文章进行类比,使用普雷斯科特滤波器从 EURUSD 报价中析出确定性成分。
系列名称中的数字“10”表示普雷斯科特滤波器中的 lambda 参数。 基于此工具背后的理论,lambda 值对于结果来说具有非常重要的意义,如下所示:
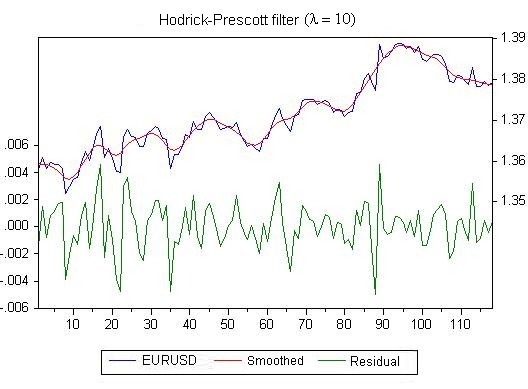
图 5 使用普雷斯科特滤波器的平滑处理结果
我们将使用上一篇文章中的方程,此方程在 EViews 记法中显示如下:
quotes = C(1) * HP(-1) + C(2) * D(HP(-1)) + C(3)*D(HP(-2))
即,在此方程中,我们将确定性成分和噪声考虑在内,噪声指的是初始报价与其确定性成分之间的差异。
根据对初始报价的当前模型的分析,我们获得了以下回归方程参数:
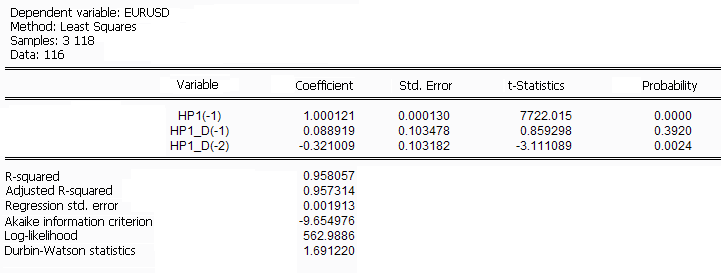
表 2 回归方程评估
如果 РќР 1_D(-1) 非常令人不满意,此系数有 39% 的概率为 0。 由于我们要提供的示例用于演示目的,我们将把一切保持原样。
获取回归方程估值(方程系数的估值)后,我们可以进行先行预测。
结果如下:
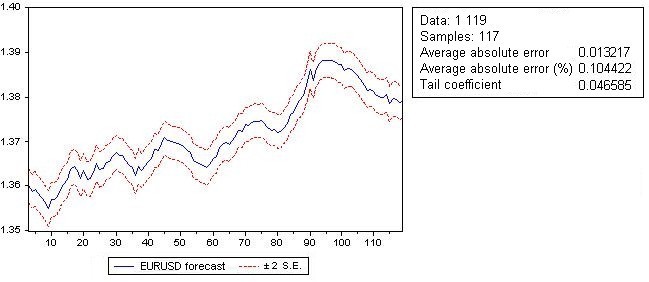
图 6 EURUSD 先行预测(截止周一午夜 12 点)
1.3. 评估回归方程的残余部分
让我们对回归方程中的残余部分执行有限分析。 此残余部分是通过从初始 EURUSD 报价中减去使用回归方程计算得出的值而得到的。
让我提醒你一下,此残余部分的特征将帮助我们评估交易系统未来的稳定性。
首先,我们将执行一个测试,以便对残余部分中延迟之间的关联进行分析:
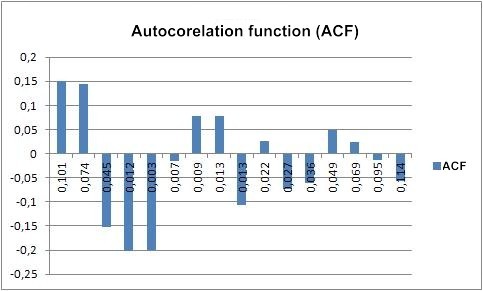
图 7 残余部分的自相关函数
遗憾的是,延迟之间仍然存在关联,其存在引起了我们对统计分析的怀疑。
我们要执行的下一个检验是残余部分的正态性检验。
结果如下:
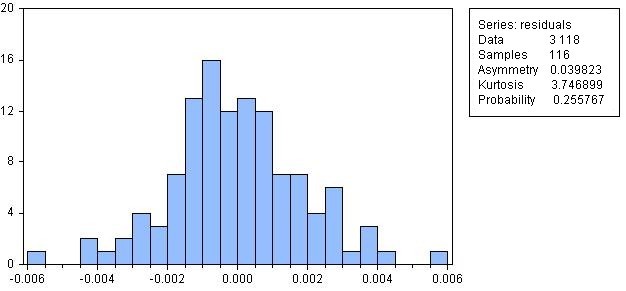
图 8 回归方程中残余部分的直方图
残余部分为正态分布的概率为 25.57%,这是一个相当大的概率。
让我们测试残余部分的异方差性。
结果如下:
由于我的目标是基于预测展示交易系统的开发情况,我将继续进行计算,以获取交易者感兴趣的特征 - 获利或亏损。
交易时,我们感兴趣的是利润而非预测误差,我们应该将预测误差作为一种辅助分析工具用于比较不同的模型,但也仅限于此。
为了评估预测结果,我们用 EViews 语言编写了一个程序。 它将 EURUSD 报价的实际增量变化与预测增量变化进行比较。 如果这些增量一致,则有利润;如果不一致,则是亏损。 我们进一步计算利润(此利润代表所有与预测增量一致的增量的总和)和亏损(同上)。
盈亏比被指定为一个盈利因子。 然后我们计算获利增量与不获利增量的比率(盈亏交易比)。 同时还要计算连续亏损交易的数量以及连续亏损交易中的亏损与利润之比(回收系数)。
使用 EViews 语言编写的程序根据交易系统评估建模结果,此程序包括主程序和两个子程序。
主(头)程序如下:
'
' One-step-ahead forecasting program
' Version of 26.09.2011
'-----------------------------------------------
 include    sub_profit_factor
 include    sub_model_2
'
' 1. Create an EViews work file under the name МТ4
'
 %path   = "C:\Program Files\BCS Trade Station\tester\files"
 cd      %path

 if @fileexist("work.wf1") = 0  then
  wfcreate(wf  = work)  u 510
 else
  wfopen   work
 endif
'
' Reads quotes from files
 read(t = txt)   kotir.txt date $ kotir
'
' Number of observations in the series without NA
 !number   = @obs(kotir)
 smpl     1  !number  - 1


 genr  trend    = NA        ' Trend = kotir_f(i) - kotir(i-1)
 genr  kotir_d  = d(kotir)  ' One-step increment in the price movement  - d(kotir)
'

' Calculate the model
 call  sub_model_2
'
' Calculate the profit table
 call sub_profit_factor

' Generate a file of results
 genr result   = 0
'
' Fill in the results
 result(1)  = kotir_f(!number)    ' One-step-ahead forecast
 result(2)  = kotir_f_se(!number) ' One-step-ahead forecast error
 result(3)  = trend(!number - 1)  ' Direction of the forecast
'-----------------------------------------------
' Return the result to МТ4
'
 smpl      1  10
 write(t=txt,na=0,d=c,dates)  EViewsForecast.txt   result

'-----------------End of program --------------
 smpl      1  !number
 save       work
 close      @all
 exit
'
'-----------------------------------------------
假定主程序的数量等于包含模型的子程序的数量(见下文);这是为了简化工作。
模型中的更改需要对包含该模型的子程序的名称的更改相关的主程序的两行进行更改。
包含模型的子程序(回归方程):
subroutine  sub_model_2

  cd
  wfselect             work
  smpl          1    !number    -  1
' Smoothing the 1st level using НР filter quote with the first lambda
' and generating two files:
'      hp1     -  smoothed file
'      p1_d    -   file of the residual
  hpf(lambda    =  10)   kotir hp1   @hp1_d
'
'  4. Estimating regression eq02 that uses the following series:
'        hp1
'        hp1_d
  equation eq1.ls   kotir   hp1(-1)   hp1_d(-1) hp1_d(-2)


'
'  Extending the sample to include the forecast area
  smpl              1 !number
'
'  Performing a one-step-ahead forecast and generating output series:
'    kotir_f     -  forecast
'    kotir_f_se  -  forecast error
  fit(p)            kotir_f   kotir_f_se

  save              work

endsub
子程序数量应等于模型数量。
对于另一个模型,应更改子程序的名称,当然还要更改主程序中的名称。
用于计算模型的获利/亏损参数的子程序:
' Subroutine for estimation of the forecast results
' Version of 27.09.2011
' ----------------------------------------------------------------------------
' Comparing the forecast increment with the quote increment,
' the program calculates:
'  profit factor with regard to increments;
'   profitability of the equation in the number of observations
'  recovery factor as a ratio of profit in pips to maximal drawdown
' ----------------------------------------------------------------------------
subroutine sub_profit_factor

' Local variables
   !profit = 0          ' Accumulated profit
   !lost = 0            ' Accumulated loss
   !profit_factor = 0   ' Profit factor
   !i = 1               ' Work index
   !n_profit = 0        ' Number of profit trades
   !n_lost = 0          ' Number of loss trades
   !n_p_l = 0           '
   !pr = 0              '  Absence of consecutive losses
   !prosadka = 0        ' Drawdown - accumulation of consecutive losses
   !tek_prosadka = 0    ' Current drawdown
   !tek_pr = 0          '  Current number of loss trades

 cd
 wfselect       work
 smpl        1   !number

' Calculate the trend on each bar
 for  !i  =  1  to  !number - 1
  trend(!i) = kotir_f(!i + 1) - kotir(!i)
 next

'  Calculate profit if the forecast has been reached
 for  !i      =  1   to  !number - 1
  if  trend(!i) * kotir_d(!i) > 0   then    ' Does the trend coincide with increment? - Yes
   !profit   = !profit + @abs(kotir_d(!i))  '  Profit accumulation
   !n_profit = !n_profit +1                 '  Profit trades accumulation
   !tek_pr   = 0                            '  Resetting the current consecutive losses at zero
   !tek_prosadka  =   0                     ' Resetting the current drawdown at zero
  endif
  if  trend(!i) * kotir_d(!i) <  0   then   ' Does the trend coincide with increment? - No
   !lost   = !lost + @abs(kotir_d(!i))      ' Loss accumulation
   !n_lost = !n_lost + 1                    ' Loss trades accumulation

   !tek_pr = !tek_pr + 1                              ' Increase the number of current loss trades
   !tek_prosadka = !tek_prosadka + @abs(kotir_d(!i))  ' Increase the current drawdown
  endif

  '  Select the maximum loss trades
  if  !tek_pr > !pr then
   !pr  = !tek_pr
  endif

  ' Select the maximal drawdown
  if  !tek_prosadka  > !prosadka  then
   !prosadka  = !tek_prosadka
  endif
 next

'   Blocking division by zero
 if !lost = 0 then                 ' No loss trades
  !profit_factor = 1000
 else
  !profit_factor = !profit / !lost  ' Profit factor
 endif

 if !n_lost = 0  then
  !n_p_l = !number      '  if loss trades are zero,
                        '  profit trades are equal to the number of observations
 else
  !n_p_l =  !n_profit / !n_lost
 endif

 if !prosadka = 0  then
  !factor_reset = 1000
 else
  !factor_reset = !profit / !prosadka
 endif

'  Create a table of results if it does not exist
 if @isobject("tab_profit") = 0    then
  table(3,12)    tab_profit
  tab_profit.title  One-step-ahead forecast after the end of sample with profitability beyond the sample

' Make the table heading
  tab_profit.setfillcolor(1) yellow
  tab_profit.setfillcolor(2) yellow

' Set the column characteristics
' 1st column
  setcolwidth(tab_profit,1,15)
  tab_profit(1,1)   = "Sample"
  tab_profit(2,1)   = "beginning"

' 2nd column
  setcolwidth(tab_profit,2,15)
  tab_profit(1,2)   = "Sample"
  tab_profit(2,2)   = "end"

' 3rd column
  setcolwidth(tab_profit,3,7)
   tab_profit(1,3)   = "Fact as of"
  tab_profit(2,3)   = "end "

' 4th column
  setcolwidth(tab_profit,4,7)
  tab_profit(1,4)   = "One-step"
  tab_profit(2,4)   = "forecast"

' 5th column
  setcolwidth(tab_profit,5,10)
  tab_profit(1,5)   = "Forecast"
  tab_profit(2,5)   = "error"

' 6th column
  setcolwidth(tab_profit,6,8)
  tab_profit(1,6)    =  "Profit of the"
  tab_profit(2,6)    =  "sample"

' 7th column
  setcolwidth(tab_profit,7,8)
  tab_profit(1,7)    =  "Loss of the"
  tab_profit(2,7)    =  "sample"

' 8th column
  setcolwidth(tab_profit,8,10)
  tab_profit(1,8)   = "Maximal"
  tab_profit(2,8)   = "drawdown"

' 9th column
  setcolwidth(tab_profit,9,8)
  tab_profit(1,9)   = "Amount of"
  tab_profit(2,9)    =  "loss"

' 10th column
  setcolwidth(tab_profit,10,7)
  tab_profit(1,10)    =  "P / F in"
  tab_profit(2,10)    =  "pips"

' 11th column
  setcolwidth(tab_profit,11,8)
  tab_profit(1,11)    =  "P / F in"
  tab_profit(2,11)    =  "observations"


' 12th column
  setcolwidth(tab_profit,12,8)
  tab_profit(1,12)   = "Recovery"
  tab_profit(2,12)   = "factor"
  tab_profit.setlines(R1C1:R2C12) +o +v
 endif

 tab_profit.insertrow(3) 1
 tab_profit.setlines(R3C1:R3C12) +a +v +i

' Set the table output format
 tab_profit.setformat(R3C1:R3C1)   c.16
 tab_profit.setformat(R3C2:R3C2)   c.16
 tab_profit.setformat(R3C3:R3C3)   f.4
 tab_profit.setformat(R3C4:R3C4)   f.4
 tab_profit.setformat(R3C5:R3C5)   f.4
 tab_profit.setformat(R3C6:R3C6)   f.4
 tab_profit.setformat(R3C7:R3C7)   f.4
 tab_profit.setformat(R3C8:R3C8)   f.4
 tab_profit.setformat(R3C9:R3C9)   f.0
 tab_profit.setformat(R3C10:R3C10) f.2
 tab_profit.setformat(R3C11:R3C11)  f.2
 tab_profit.setformat(R3C12:R3C12) f.2

' Fill the table with the results
 tab_profit(3 ,1) = date(1)
 tab_profit(3 ,2) = date(!number - 1)
 tab_profit(3 ,3) = kotir(!number - 1)
 tab_profit(3 ,4) = kotir_f(!number - 1)
 tab_profit(3 ,5) = kotir_f_se(!number - 1)

 tab_profit(3 ,6) =  !profit
 tab_profit(3 ,7) =  !lost
 tab_profit(3 ,8) = !prosadka
 tab_profit(3 ,9) = !pr
 tab_profit(3,10) =  !profit_factor
 tab_profit(3,11) = !n_p_l
 tab_profit(3,12) = !factor_reset


' Save the table in the work file
 save        work
 show        tab_profit

endsub
对于我们的方程,上述简单的 EViews 程序的结果如下:

表 3 EViews 中的盈利能力评估结果
到现在为止,我们一直在使用 EViews 工具分析 EURUSD_H1 报价。
但是,将预测结果应用于 MetaTrader 4 终端的 Expert Advisor 显然是一个很诱人的想法。
现在让我们考虑在 EViews 与 MetaTrader 4 之间进行数据交换,然后再次使用 MetaTrader 4 中的 Expert Advisor分析结果。
本文中,EViews 与 MetaTrader 4 之间的数据交换是使用 .txt 文件实现的。
交换算法如下:
MetaTrader 4 Expert Advisor:
EViews:
MetaTrader 4 Expert Advisor:
下面我们来说一说文件的位置。
MetaTrader 4 终端的文件位于其标准文件夹内:Expert Advisor 在 \expert 文件夹中,指标(测试时不需要它)在 \expert\indicators 文件夹中。 上述文件都位于终端目录下。 此 Expert Advisor 与其他 Expert Advisor 安装在一起。
Expert Advisor 与 EViews 之间的数据交换文件在 Expert Advisor 运行期间位于 \expert\files 中,在测试 Expert Advisor 时位于 \tester\files 文件夹。
无论是什么选定交易品种和时间范围,Expert Advisor 发送到 EViews 的文件都会被命名为 quotes.txt 。 因此,Expert Advisor 可连接到任何交易品种,而预测步骤应在 Expert Advisor 启动时在其参数中指定。
EViews 返回名为 EVIEWSFORECAST.txt 的文件。 EViews 工作文件 worf.wf1 放在终端目录下。
本文随附的 EViews 程序中指定的目录很可能与你计算机上的可用目录不一致。 我把这些程序装在磁盘根文件夹下。 在 EViews 中,你必须能够控制默认目录或指定你自己的目录(我未使用 EViews 自身使用的默认目录)。
将 Expert Advisor 运行算法最简化:
Expert Advisor 连接到 M1 时间范围,而在测试程序中,可以在 M5 上更好地查看图表。
用于交易 EURUSD 的 MQL4 Expert Advisor 源代码较长(约 600 行),篇幅所限,文中不再显示。 可以在本文随附的 EViews_MetaTrader_4.zip 资料中的 EvewsMT4.mq4 中找到它。
在测试程序中针对 M1 时间范围运行 Expert Advisor。
输入参数如下所示。
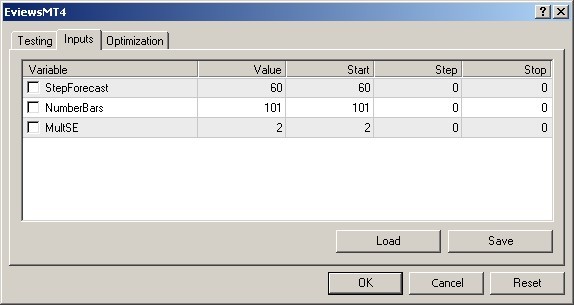
图 9 Expert Advisor 的输入参数
以下是测试图表的一个片段:
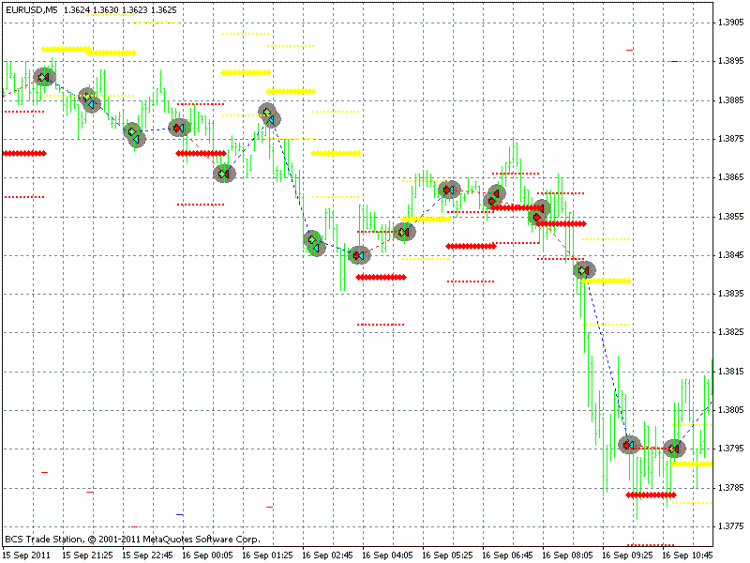
图 10 在可视化模式下测试 Expert Advisor
使用提前一小时(步骤)预测的 Expert Advisor 的测试结果如下所示。
策略测试程序报告
EvewsMT4
Real (Build 406)
交易品种: |
EURUSD (欧元 vs 美元) |
||||
时间范围 |
1 分钟 (M1) 2011.09.12 00:00 - 2011.09.16 21:59 (2011.09.12 - 2011.09.17) |
||||
模型 |
每次价格变动(基于最短可用时间范围的最精确模式) |
||||
参数 |
StepForecast=60; NumberBars=101; MultSE=2; |
||||
历史记录中的柱体 |
7948 |
价格变动已建模 |
79777 |
建模质量 |
25.00% |
不匹配的图表误差 |
0 |
||||
初始保证金 |
10000.00 |
||||
净利润 |
-202.10 |
毛利润 |
940.72 |
毛亏损 |
-1142.82 |
获利系数 |
0.82 |
预计获利 |
-1.73 |
||
绝对亏损 |
326.15 |
最大亏损 |
456.15 (4.50%) |
相对亏损 |
4.50% (456.15) |
总交易次数 |
117 |
空头仓位(获利 %) |
58 (51.72%) |
多头仓位(获利 %) |
59 (45.76%) |
盈利交易(总交易次数的百分比) |
57 (48.72%) |
亏损交易(总交易次数的百分比) |
60 (51.28%) |
||
最大 |
获利交易 |
100.00 |
亏损交易 |
-79.00 |
|
平均 |
获利交易 |
16.50 |
亏损交易 |
-19.05 |
|
最大 |
连续获利交易次数(盈利金额) |
6 (105.00) |
连续亏损交易次数(亏损金额) |
8 (-162.00) |
|
最大 |
连续获利(次数) |
166.00 (5) |
连续亏损(次数) |
-162.00 (8) |
|
平均 |
连续盈利 |
2 |
连续亏损 |
2
|
|

编号 |
时间 |
类型 |
订单 |
交易量 |
价格 |
S/L |
T/P |
利润 |
余额 |
1 |
2011.09.12 01:00 |
卖出 |
1 |
0.10 |
1.3609 |
1.3711 |
1.3509 |
||
2 |
2011.09.12 上午 2:00 |
平仓 |
1 |
0.10 |
1.3584 |
1.3711 |
1.3509 |
25.00 |
10025.00 |
图 11 Expert Advisor 测试结果
结果比在 EViews 中获得的结果好。
注意,在 EViews 中计算结果和在测试程序中计算结果时采用的输入数据有所不同。 EViews 使用 118 个条柱,并从左侧的条柱 3 开始计算预测值,当先一步预测逐渐推进至周期结束时,会逐渐增加在评估回归方程时使用的条柱数量。
Expert Advisor 转换 118 个条柱的窗口并在条柱 119 上计算预测值,即由于 EViews 展开样本内的窗口且 Expert Advisor 转换固定宽度的窗口,将始终在 118 个条柱上评估回归方程。
Expert Advisor 帮助我们生成一个扩展模型评估表。 虽然上表只包含一根线,但现在它包含 117 根线 - 针对生成预测值的每个日期。
表格如下:
| 样本 开始时间 |
样本 开始时间 |
至结束为止 的实际情况样本 |
一步 预测 |
预测 错误 |
样本 开始时间 |
样本 开始时间 |
Maximal drawdown |
亏损 金额 |
P/F(单位为 基点) |
P/F(观察结果) |
回收系数 |
|---|---|---|---|---|---|---|---|---|---|---|---|
| 12.09.2011 0:00 | 16.09.2011 21:00 | 1,3791 | 1,3788 | 0,0019 | 0,0581 | 0,1531 | 0,0245 | 7 | 0,38 | 0,67 | 2,37 |
| 12.09.2011 0:00 | 16.09.2011 21:00 | 1,3791 | 1,3788 | 0,0019 | 0,0581 | 0,1531 | 0,0245 | 7 | 0,38 | 0,67 | 2,37 |
| 09.09.2011 21:00 | 16.09.2011 下午 8:00 | 1,3784 | 1,3793 | 0,0019 | 0,0569 | 0,1619 | 0,0245 | 7 | 0,35 | 0,64 | 2,32 |
| 09.09.2011 下午 8:00 | 16.09.2011 下午 7:00 | 1,3794 | 1,3796 | 0,002 | 0,0596 | 0,1609 | 0,0245 | 7 | 0,37 | 0,67 | 2,43 |
| 09.09.2011 下午 7:00 | 16.09.2011 下午 6:00 | 1,3783 | 1,3782 | 0,0021 | 0,0642 | 0,1554 | 0,0245 | 7 | 0,41 | 0,69 | 2,62 |
| 09.09.2011 下午 6:00 | 16.09.2011 下午 5:00 | 1,3783 | 1,3806 | 0,002 | 0,0616 | 0,1606 | 0,0245 | 7 | 0,38 | 0,68 | 2,51 |
| 09.09.2011 下午 5:00 | 16.09.2011 下午 4:00 | 1,3829 | 1,3806 | 0,002 | 0,0642 | 0,1586 | 0,0245 | 7 | 0,4 | 0,71 | 2,62 |
| 09.09.2011 下午 4:00 | 16.09.2011 下午 3:00 | 1,3788 | 1,3793 | 0,002 | 0,0626 | 0,1565 | 0,0245 | 7 | 0,4 | 0,71 | 2,56 |
| 09.09.2011 下午 3:00 | 16.09.2011 下午 2:00 | 1,3798 | 1,38 | 0,0021 | 0,063 | 0,1633 | 0,0245 | 7 | 0,39 | 0,73 | 2,57 |
| 09.09.2011 下午 2:00 | 16.09.2011 下午 1:00 | 1,3808 | 1,381 | 0,0022 | 0,062 | 0,1656 | 0,0318 | 9 | 0,37 | 0,71 | 1,95 |
| 09.09.2011 下午 1:00 | 16.09.2011 下午 12:00 | 1,3809 | 1,3813 | 0,0021 | 0,0602 | 0,1679 | 0,0318 | 9 | 0,36 | 0,66 | 1,89 |
| 09.09.2011 下午 12:00 | 16.09.2011 上午 11:00 | 1,3792 | 1,3808 | 0,0021 | 0,0666 | 0,1613 | 0,0245 | 7 | 0,41 | 0,73 | 2,72 |
| 09.09.2011 上午 11:00 | 16.09.2011 上午 10:00 | 1,3795 | 1,3826 | 0,0021 | 0,0666 | 0,167 | 0,0245 | 7 | 0,4 | 0,73 | 2,72 |
| 09.09.2011 上午 10:00 | 16.09.2011 上午 9:00 | 1,3838 | 1,3847 | 0,0022 | 0,0652 | 0,1668 | 0,0318 | 9 | 0,39 | 0,71 | 2,05 |
| 09.09.2011 上午 9:00 | 16.09.2011 上午 8:00 | 1,3856 | 1,3854 | 0,0022 | 0,0675 | 0,165 | 0,0318 | 9 | 0,41 | 0,73 | 2,12 |
| 09.09.2011 上午 8:00 | 16.09.2011 上午 7:00 | 1,386 | 1,3856 | 0,0022 | 0,0671 | 0,1652 | 0,0318 | 9 | 0,41 | 0,71 | 2,11 |
| 09.09.2011 上午 7:00 | 16.09.2011 上午 6:00 | 1,3861 | 1,3857 | 0,0022 | 0,067 | 0,1663 | 0,0318 | 9 | 0,4 | 0,68 | 2,11 |
| 09.09.2011 上午 6:00 | 16.09.2011 上午 5:00 | 1,3852 | 1,3855 | 0,0022 | 0,0655 | 0,1681 | 0,0318 | 9 | 0,39 | 0,63 | 2,06 |
| 09.09.2011 上午 5:00 | 16.09.2011 上午 4:00 | 1,3844 | 1,3851 | 0,0022 | 0,0662 | 0,1674 | 0,0318 | 9 | 0,4 | 0,66 | 2,08 |
| 09.09.2011 上午 4:00 | 16.09.2011 上午 3:00 | 1,3848 | 1,3869 | 0,0022 | 0,0654 | 0,1683 | 0,0318 | 9 | 0,39 | 0,68 | 2,06 |
| 09.09.2011 上午 3:00 | 16.09.2011 上午 2:00 | 1,3879 | 1,3875 | 0,0022 | 0,0694 | 0,1624 | 0,0318 | 9 | 0,43 | 0,73 | 2,18 |
| 09.09.2011 上午 2:00 | 16.09.2011 上午 1:00 | 1,3865 | 1,3879 | 0,0022 | 0,0698 | 0,1634 | 0,0318 | 9 | 0,43 | 0,71 | 2,19 |
| 09.09.2011 上午 1:00 | 16.09.2011 上午 12:00 | 1,3881 | 1,3883 | 0,0022 | 0,0726 | 0,1604 | 0,0245 | 7 | 0,45 | 0,76 | 2,96 |
| 09.09.2011 上午 12:00 | 15.09.2011 23:00 | 1,3876 | 1,3882 | 0,0022 | 0,0721 | 0,162 | 0,0245 | 7 | 0,45 | 0,73 | 2,94 |
| 08.09.2011 23:00 | 15.09.2011 下午 10:00 | 1,3885 | 1,3884 | 0,0022 | 0,0718 | 0,1614 | 0,0245 | 7 | 0,44 | 0,72 | 2,93 |
| 08.09.2011 下午 10:00 | 15.09.2011 下午 9:00 | 1,3888 | 1,3883 | 0,0022 | 0,0737 | 0,1597 | 0,0245 | 7 | 0,46 | 0,77 | 3,01 |
| 08.09.2011 下午 9:00 | 15.09.2011 下午 8:00 | 1,3885 | 1,3874 | 0,0022 | 0,0729 | 0,1604 | 0,0318 | 9 | 0,45 | 0,74 | 2,29 |
| 08.09.2011 下午 8:00 | 15.09.2011 下午 7:00 | 1,3867 | 1,386 | 0,0022 | 0,0721 | 0,1604 | 0,0318 | 9 | 0,45 | 0,74 | 2,27 |
| 08.09.2011 下午 7:00 | 15.09.2011 下午 6:00 | 1,3856 | 1,3834 | 0,0022 | 0,0721 | 0,1628 | 0,0318 | 9 | 0,44 | 0,72 | 2,27 |
| 08.09.2011 下午 6:00 | 15.09.2011 下午 5:00 | 1,385 | 1,3861 | 0,0023 | 0,0702 | 0,1651 | 0,0318 | 9 | 0,43 | 0,72 | 2,21 |
| 08.09.2011 下午 5:00 | 15.09.2011 下午 4:00 | 1,3885 | 1,3824 | 0,0023 | 0,0739 | 0,1638 | 0,0245 | 7 | 0,45 | 0,72 | 3,02 |
| 08.09.2011 下午 4:00 | 15.09.2011 下午 3:00 | 1,3773 | 1,3784 | 0,0021 | 0,0719 | 0,1556 | 0,0318 | 9 | 0,46 | 0,72 | 2,26 |
| 08.09.2011 下午 3:00 | 15.09.2011 下午 2:00 | 1,3795 | 1,3794 | 0,0021 | 0,0726 | 0,1537 | 0,0318 | 9 | 0,47 | 0,72 | 2,28 |
| 08.09.2011 下午 2:00 | 15.09.2011 下午 1:00 | 1,3814 | 1,3792 | 0,0021 | 0,0736 | 0,1564 | 0,0318 | 9 | 0,47 | 0,74 | 2,31 |
| 08.09.2011 下午 1:00 | 15.09.2011 下午 12:00 | 1,3802 | 1,3764 | 0,0021 | 0,0712 | 0,159 | 0,0318 | 9 | 0,45 | 0,74 | 2,24 |
| 08.09.2011 下午 12:00 | 15.09.2011 上午 11:00 | 1,3769 | 1,3753 | 0,0021 | 0,0719 | 0,1568 | 0,0318 | 9 | 0,46 | 0,72 | 2,26 |
| 08.09.2011 上午 11:00 | 15.09.2011 上午 10:00 | 1,3765 | 1,3732 | 0,0021 | 0,0721 | 0,1564 | 0,0318 | 9 | 0,46 | 0,74 | 2,27 |
| 08.09.2011 上午 10:00 | 15.09.2011 上午 9:00 | 1,3722 | 1,3718 | 0,0021 | 0,0716 | 0,1538 | 0,0318 | 9 | 0,47 | 0,72 | 2,25 |
| 08.09.2011 上午 8:00 | 15.09.2011 上午 7:00 | 1,371 | 1,3716 | 0,0021 | 0,0729 | 0,1542 | 0,0318 | 9 | 0,47 | 0,74 | 2,29 |
| 08.09.2011 上午 8:00 | 15.09.2011 上午 7:00 | 1,371 | 1,3716 | 0,0021 | 0,0729 | 0,1542 | 0,0318 | 9 | 0,47 | 0,74 | 2,29 |
| 08.09.2011 上午 7:00 | 15.09.2011 上午 6:00 | 1,3723 | 1,3727 | 0,0021 | 0,0716 | 0,1547 | 0,0318 | 9 | 0,46 | 0,72 | 2,25 |
| 08.09.2011 上午 6:00 | 15.09.2011 上午 5:00 | 1,3726 | 1,3725 | 0,0021 | 0,0711 | 0,1564 | 0,0318 | 9 | 0,45 | 0,69 | 2,24 |
| 08.09.2011 上午 5:00 | 15.09.2011 上午 4:00 | 1,3719 | 1,3731 | 0,0021 | 0,0711 | 0,1563 | 0,0318 | 9 | 0,45 | 0,69 | 2,24 |
| 08.09.2011 上午 4:00 | 15.09.2011 上午 3:00 | 1,374 | 1,3744 | 0,0021 | 0,0713 | 0,1547 | 0,0318 | 9 | 0,46 | 0,69 | 2,24 |
| 08.09.2011 上午 3:00 | 15.09.2011 上午 2:00 | 1,3748 | 1,3747 | 0,0021 | 0,0705 | 0,1547 | 0,0318 | 9 | 0,46 | 0,68 | 2,22 |
| 08.09.2011 上午 2:00 | 15.09.2011 上午 1:00 | 1,3743 | 1,3742 | 0,0021 | 0,0715 | 0,1544 | 0,0318 | 9 | 0,46 | 0,7 | 2,25 |
| 08.09.2011 上午 1:00 | 15.09.2011 上午 12:00 | 1,3738 | 1,3743 | 0,0021 | 0,0714 | 0,1544 | 0,0318 | 9 | 0,46 | 0,7 | 2,25 |
| 08.09.2011 上午 12:00 | 14.09.2011 23:00 | 1,375 | 1,3743 | 0,0021 | 0,0724 | 0,1532 | 0,0318 | 9 | 0,47 | 0,73 | 2,28 |
| 07.09.2011 23:00 | 14.09.2011 下午 10:00 | 1,375 | 1,3736 | 0,0021 | 0,0727 | 0,1532 | 0,0318 | 9 | 0,47 | 0,74 | 2,29 |
| 07.09.2011 下午 10:00 | 14.09.2011 下午 9:00 | 1,3751 | 1,3735 | 0,0021 | 0,0734 | 0,1532 | 0,0318 | 9 | 0,48 | 0,74 | 2,31 |
| 07.09.2011 下午 9:00 | 14.09.2011 下午 8:00 | 1,3748 | 1,3716 | 0,0021 | 0,0722 | 0,1555 | 0,0318 | 9 | 0,46 | 0,72 | 2,27 |
| 07.09.2011 下午 8:00 | 14.09.2011 下午 7:00 | 1,3714 | 1,3712 | 0,0021 | 0,0812 | 0,145 | 0,0189 | 6 | 0,56 | 0,74 | 4,3 |
| 07.09.2011 下午 7:00 | 14.09.2011 下午 6:00 | 1,371 | 1,3697 | 0,0021 | 0,0692 | 0,1577 | 0,0318 | 9 | 0,44 | 0,69 | 2,18 |
| 07.09.2011 下午 6:00 | 14.09.2011 下午 5:00 | 1,3673 | 1,369 | 0,0021 | 0,0695 | 0,154 | 0,0318 | 9 | 0,45 | 0,72 | 2,19 |
| 07.09.2011 下午 5:00 | 14.09.2011 下午 4:00 | 1,3687 | 1,3693 | 0,0021 | 0,0695 | 0,1548 | 0,0318 | 9 | 0,45 | 0,72 | 2,19 |
| 07.09.2011 下午 4:00 | 14.09.2011 下午 3:00 | 1,3704 | 1,3704 | 0,0021 | 0,066 | 0,1591 | 0,0318 | 11 | 0,41 | 0,69 | 2,08 |
| 07.09.2011 下午 3:00 | 14.09.2011 下午 2:00 | 1,373 | 1,37 | 0,002 | 0,066 | 0,1577 | 0,0318 | 10 | 0,42 | 0,69 | 2,08 |
| 07.09.2011 下午 2:00 | 14.09.2011 下午 1:00 | 1,3712 | 1,3681 | 0,002 | 0,066 | 0,1562 | 0,0318 | 9 | 0,42 | 0,69 | 2,08 |
| 07.09.2011 下午 1:00 | 14.09.2011 下午 12:00 | 1,3685 | 1,3653 | 0,002 | 0,0665 | 0,1534 | 0,0318 | 9 | 0,43 | 0,74 | 2,09 |
| 07.09.2011 下午 12:00 | 14.09.2011 上午 11:00 | 1,3655 | 1,3646 | 0,002 | 0,0673 | 0,1504 | 0,0318 | 9 | 0,45 | 0,77 | 2,12 |
| 07.09.2011 上午 11:00 | 14.09.2011 上午 10:00 | 1,3656 | 1,3634 | 0,002 | 0,0709 | 0,15 | 0,0318 | 9 | 0,47 | 0,77 | 2,23 |
| 07.09.2011 上午 10:00 | 14.09.2011 上午 9:00 | 1,3625 | 1,3625 | 0,002 | 0,0725 | 0,1461 | 0,0318 | 9 | 0,5 | 0,83 | 2,28 |
| 07.09.2011 上午 9:00 | 14.09.2011 上午 8:00 | 1,3631 | 1,3638 | 0,002 | 0,0719 | 0,1465 | 0,0318 | 9 | 0,49 | 0,8 | 2,26 |
| 07.09.2011 上午 8:00 | 14.09.2011 上午 7:00 | 1,3641 | 1,3643 | 0,002 | 0,0707 | 0,1481 | 0,0318 | 9 | 0,48 | 0,77 | 2,22 |
| 07.09.2011 上午 7:00 | 14.09.2011 上午 6:00 | 1,3635 | 1,3648 | 0,002 | 0,0724 | 0,1481 | 0,0318 | 9 | 0,49 | 0,8 | 2,28 |
| 07.09.2011 上午 6:00 | 14.09.2011 上午 5:00 | 1,3647 | 1,3656 | 0,002 | 0,0724 | 0,1476 | 0,0318 | 9 | 0,49 | 0,8 | 2,28 |
| 07.09.2011 上午 5:00 | 14.09.2011 上午 4:00 | 1,3665 | 1,3676 | 0,002 | 0,0667 | 0,1536 | 0,0318 | 9 | 0,43 | 0,72 | 2,1 |
| 07.09.2011 上午 4:00 | 14.09.2011 上午 3:00 | 1,3694 | 1,3683 | 0,002 | 0,0675 | 0,1504 | 0,0318 | 9 | 0,45 | 0,74 | 2,12 |
| 07.09.2011 上午 3:00 | 14.09.2011 上午 2:00 | 1,3682 | 1,3682 | 0,002 | 0,0672 | 0,1498 | 0,0318 | 9 | 0,45 | 0,74 | 2,11 |
| 07.09.2011 上午 2:00 | 14.09.2011 上午 1:00 | 1,3684 | 1,3686 | 0,002 | 0,067 | 0,1512 | 0,0318 | 9 | 0,44 | 0,72 | 2,11 |
| 07.09.2011 上午 1:00 | 14.09.2011 上午 12:00 | 1,3679 | 1,3686 | 0,002 | 0,067 | 0,1514 | 0,0318 | 9 | 0,44 | 0,72 | 2,11 |
| 07.09.2011 上午 12:00 | 13.09.2011 23:00 | 1,3678 | 1,3691 | 0,002 | 0,0679 | 0,1507 | 0,0318 | 9 | 0,45 | 0,74 | 2,14 |
| 06.09.2011 23:00 | 13.09.2011 下午 10:00 | 1,3692 | 1,3698 | 0,002 | 0,066 | 0,1517 | 0,0318 | 9 | 0,44 | 0,69 | 2,08 |
| 06.09.2011 下午 10:00 | 13.09.2011 下午 9:00 | 1,3708 | 1,3705 | 0,002 | 0,0652 | 0,1512 | 0,0318 | 9 | 0,43 | 0,69 | 2,05 |
| 06.09.2011 下午 9:00 | 13.09.2011 下午 8:00 | 1,3719 | 1,3709 | 0,002 | 0,0652 | 0,1512 | 0,0318 | 9 | 0,43 | 0,69 | 2,05 |
| 06.09.2011 下午 8:00 | 13.09.2011 下午 7:00 | 1,371 | 1,3691 | 0,002 | 0,0652 | 0,1517 | 0,0318 | 9 | 0,43 | 0,69 | 2,05 |
| 06.09.2011 下午 7:00 | 13.09.2011 下午 6:00 | 1,3677 | 1,3669 | 0,002 | 0,0666 | 0,1485 | 0,0318 | 9 | 0,45 | 0,72 | 2,09 |
| 06.09.2011 下午 6:00 | 13.09.2011 下午 5:00 | 1,3678 | 1,3677 | 0,002 | 0,0666 | 0,149 | 0,0318 | 9 | 0,45 | 0,72 | 2,09 |
| 06.09.2011 下午 5:00 | 13.09.2011 下午 4:00 | 1,3698 | 1,3659 | 0,002 | 0,0625 | 0,1555 | 0,0318 | 9 | 0,4 | 0,64 | 1,97 |
| 06.09.2011 下午 4:00 | 13.09.2011 下午 3:00 | 1,3658 | 1,3643 | 0,002 | 0,065 | 0,1513 | 0,0318 | 9 | 0,43 | 0,72 | 2,04 |
| 06.09.2011 下午 3:00 | 13.09.2011 下午 2:00 | 1,3665 | 1,3636 | 0,002 | 0,0643 | 0,1527 | 0,0318 | 9 | 0,42 | 0,69 | 2,02 |
| 06.09.2011 下午 2:00 | 13.09.2011 下午 1:00 | 1,3639 | 1,3619 | 0,002 | 0,0659 | 0,1552 | 0,0318 | 9 | 0,42 | 0,74 | 2,07 |
| 06.09.2011 下午 1:00 | 13.09.2011 下午 12:00 | 1,3617 | 1,3628 | 0,0021 | 0,0824 | 0,1432 | 0,0189 | 6 | 0,58 | 0,8 | 4,36 |
| 06.09.2011 下午 12:00 | 13.09.2011 上午 11:00 | 1,3616 | 1,361 | 0,0021 | 0,0824 | 0,1435 | 0,0189 | 6 | 0,57 | 0,8 | 4,36 |
| 06.09.2011 上午 11:00 | 13.09.2011 上午 10:00 | 1,3582 | 1,3631 | 0,002 | 0,0795 | 0,1435 | 0,0189 | 6 | 0,55 | 0,8 | 4,21 |
| 06.09.2011 上午 10:00 | 13.09.2011 上午 9:00 | 1,3654 | 1,3656 | 0,002 | 0,077 | 0,146 | 0,0189 | 6 | 0,53 | 0,74 | 4,07 |
| 06.09.2011 上午 9:00 | 13.09.2011 上午 8:00 | 1,3655 | 1,3664 | 0,0021 | 0,0813 | 0,1442 | 0,0189 | 6 | 0,56 | 0,77 | 4,3 |
| 06.09.2011 上午 8:00 | 13.09.2011 上午 7:00 | 1,3679 | 1,3673 | 0,0022 | 0,0834 | 0,1435 | 0,0189 | 6 | 0,58 | 0,77 | 4,41 |
| 06.09.2011 上午 7:00 | 13.09.2011 上午 6:00 | 1,3685 | 1,3668 | 0,0022 | 0,0828 | 0,1448 | 0,0189 | 6 | 0,57 | 0,74 | 4,38 |
| 06.09.2011 上午 6:00 | 13.09.2011 上午 5:00 | 1,3676 | 1,3669 | 0,0022 | 0,0879 | 0,1406 | 0,0189 | 6 | 0,63 | 0,85 | 4,65 |
| 06.09.2011 上午 5:00 | 13.09.2011 上午 4:00 | 1,3669 | 1,3653 | 0,0022 | 0,0821 | 0,1458 | 0,0189 | 6 | 0,56 | 0,8 | 4,34 |
| 06.09.2011 上午 4:00 | 13.09.2011 上午 3:00 | 1,3635 | 1,3639 | 0,0022 | 0,0821 | 0,1428 | 0,0189 | 6 | 0,57 | 0,8 | 4,34 |
| 06.09.2011 上午 3:00 | 13.09.2011 上午 2:00 | 1,3637 | 1,3646 | 0,0022 | 0,0821 | 0,1428 | 0,0189 | 6 | 0,57 | 0,8 | 4,34 |
| 06.09.2011 上午 2:00 | 13.09.2011 上午 1:00 | 1,3657 | 1,364 | 0,0022 | 0,0825 | 0,1407 | 0,0189 | 6 | 0,59 | 0,8 | 4,37 |
| 06.09.2011 上午 1:00 | 13.09.2011 上午 12:00 | 1,366 | 1,3639 | 0,0022 | 0,085 | 0,1384 | 0,0141 | 6 | 0,61 | 0,83 | 6,03 |
| 06.09.2011 上午 12:00 | 12.09.2011 下午 11:00 | 1,3678 | 1,3655 | 0,0022 | 0,083 | 0,1416 | 0,0141 | 6 | 0,59 | 0,8 | 5,89 |
| 05.09.2011 23:00 | 12.09.2011 下午 10:00 | 1,366 | 1,3613 | 0,0022 | 0,0806 | 0,1424 | 0,0123 | 6 | 0,57 | 0,8 | 6,55 |
| 05.09.2011 下午 10:00 | 12.09.2011 下午 9:00 | 1,3572 | 1,3585 | 0,002 | 0,0731 | 0,1414 | 0,0152 | 6 | 0,52 | 0,77 | 4,81 |
| 05.09.2011 下午 9:00 | 12.09.2011 下午 8:00 | 1,3576 | 1,3601 | 0,002 | 0,0714 | 0,1432 | 0,0152 | 6 | 0,5 | 0,74 | 4,7 |
| 05.09.2011 下午 8:00 | 12.09.2011 下午 7:00 | 1,3607 | 1,3637 | 0,0021 | 0,0712 | 0,1406 | 0,0129 | 6 | 0,51 | 0,74 | 5,52 |
| 05.09.2011 下午 7:00 | 12.09.2011 下午 6:00 | 1,3632 | 1,3619 | 0,0021 | 0,0712 | 0,1405 | 0,0129 | 6 | 0,51 | 0,74 | 5,52 |
| 05.09.2011 下午 6:00 | 12.09.2011 下午 5:00 | 1,3609 | 1,3641 | 0,0021 | 0,073 | 0,1378 | 0,0129 | 6 | 0,53 | 0,77 | 5,66 |
| 05.09.2011 下午 5:00 | 12.09.2011 下午 4:00 | 1,3684 | 1,3659 | 0,002 | 0,0713 | 0,1334 | 0,0083 | 6 | 0,53 | 0,74 | 8,59 |
| 05.09.2011 下午 4:00 | 12.09.2011 下午 3:00 | 1,3665 | 1,3636 | 0,002 | 0,0727 | 0,1343 | 0,0083 | 6 | 0,54 | 0,77 | 8,76 |
| 05.09.2011 下午 3:00 | 12.09.2011 下午 2:00 | 1,363 | 1,3601 | 0,002 | 0,072 | 0,1348 | 0,0083 | 6 | 0,53 | 0,77 | 8,67 |
| 05.09.2011 下午 2:00 | 12.09.2011 下午 1:00 | 1,3603 | 1,3594 | 0,002 | 0,0752 | 0,1304 | 0,0083 | 6 | 0,58 | 0,83 | 9,06 |
| 05.09.2011 下午 1:00 | 12.09.2011 下午 12:00 | 1,3623 | 1,3589 | 0,002 | 0,0742 | 0,1304 | 0,0083 | 6 | 0,57 | 0,83 | 8,94 |
| 05.09.2011 下午 12:00 | 12.09.2011 上午 11:00 | 1,3597 | 1,3561 | 0,0019 | 0,0737 | 0,1291 | 0,0083 | 6 | 0,57 | 0,8 | 8,88 |
| 05.09.2011 上午 11:00 | 12.09.2011 上午 10:00 | 1,3561 | 1,3551 | 0,0019 | 0,0729 | 0,1275 | 0,0083 | 6 | 0,57 | 0,8 | 8,78 |
| 05.09.2011 上午 10:00 | 12.09.2011 上午 9:00 | 1,3556 | 1,3552 | 0,002 | 0,072 | 0,1283 | 0,0083 | 6 | 0,56 | 0,77 | 8,67 |
| 05.09.2011 上午 9:00 | 12.09.2011 上午 8:00 | 1,3536 | 1,3532 | 0,002 | 0,072 | 0,1271 | 0,0083 | 6 | 0,57 | 0,77 | 8,67 |
| 05.09.2011 上午 8:00 | 12.09.2011 上午 7:00 | 1,3519 | 1,3554 | 0,0019 | 0,0703 | 0,1288 | 0,0083 | 6 | 0,55 | 0,74 | 8,47 |
| 05.09.2011 上午 7:00 | 12.09.2011 上午 6:00 | 1,3583 | 1,3579 | 0,0019 | 0,072 | 0,1224 | 0,0083 | 6 | 0,59 | 0,77 | 8,67 |
| 05.09.2011 上午 6:00 | 12.09.2011 上午 5:00 | 1,3591 | 1,3582 | 0,0019 | 0,0715 | 0,1224 | 0,0083 | 6 | 0,58 | 0,77 | 8,61 |
| 05.09.2011 上午 5:00 | 12.09.2011 上午 4:00 | 1,3593 | 1,3589 | 0,0019 | 0,0713 | 0,1224 | 0,0083 | 6 | 0,58 | 0,75 | 8,59 |
| 05.09.2011 上午 3:00 | 12.09.2011 上午 2:00 | 1,3583 | 1,361 | 0,0019 | 0,0746 | 0,1192 | 0,0083 | 6 | 0,63 | 0,78 | 8,99 |
表 4 EViews 中的测试结果
此表说明我们的模型(非常原始,很不成熟)几乎没什么实用价值。 它需要改进。
让我们绘制两列的图表: P/F(单位为基点)和 P/F(观察结果)。
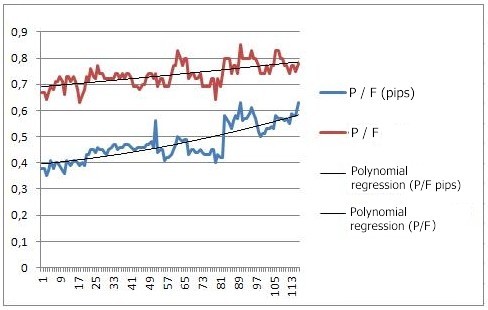
图 12 在 118 个条柱的样本上构建获利系数图表的模型
此图表展示了获利因子与分析中所用条柱数量的依赖关系。 这是一个明显的上涨趋势。
让我们检查 238 个条柱的样本的测试结果。 绘制的图表如下:
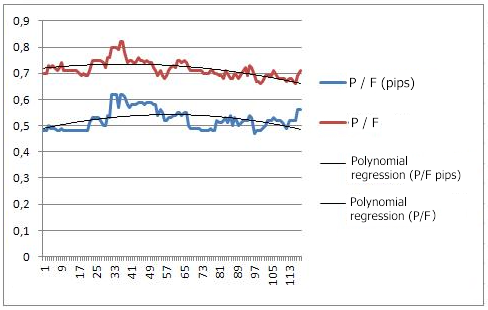
图 13 在 236 个条柱的样本上构建获利系数图表的模型
获利系数图表发生了变化,这说明这个模型并不稳定。
本文介绍了如何使用 EViews 产生的先一步预测值在 MetaTrader 4 中开发 Expert Advisor。
我们获得的负面结果表明,在 EViews 中建模是一项相当复杂的任务,虽说如此,它看上去比 Expert Advisor 的直观开发更具生产潜力。

本社区仅针对特定人员开放
查看需注册登录并通过风险意识测评
5秒后跳转登录页面...
移动端课程
