MQL4 中有 6 种绘图风格。而 MQL5 中则有 18 种绘图风格。因此,可能很有必要撰写一篇文章,专门介绍 MQL5 的绘图风格。
我们会在本文研究 MQL5 中的绘图风格详情。此外,我们还会创建一个指标来展示如何使用这些绘图风格,并细化标绘。MQL4 中没有“标绘”概念,但 SetIndexStyle() 函数的第一个参数 - 行索引等同于标绘索引。
void SetIndexStyle( int index, int type, int style=EMPTY, int width=EMPTY, color clr=CLR_NONE)
// 这个索引是行索引.
MQL4 中仅有 6 种绘图风格,除 DRAW_ZIGZAG 需要两个缓冲区外,其余 5 种组图风格都只需要一个缓冲区。
因此,在 MQL4 中,SetIndexStyle() 函数的第一个参数作为缓冲区索引也就很容易理解了。如果您不使用 DRAW_ZIGZAG 也没关系。顺便问一下,您看过利用 DRAW_ZIGZAG 实现的 MQL4 指标吗?我没见过。(ZigZag.mq4 利用 DRAW_SECTION 实现)。
我们来对比一下 MQL4 与 MQL5 的绘图风格:

表 1. MQL4 与 MQL5 绘图风格列表
您看出什么了?MQL5 中新添了 12 种绘图风格,而且有 8 种带有颜色缓冲区的新绘图风格。它可不能含含糊糊地像以前那样使用,行索引的概念太容易混淆了。
由此,MQL5 会赋予您一个“标绘”,它等同于 MQL4 中的“行”,您可以在指标窗口中绘制。
您不仅可以在 MQL5 中绘制行,其名称亦因“标绘”而更加精确。
我们在这时解释一下“缓冲模式”的概念。某绘图风格的“缓冲模式”是指“缓冲”数量、类型及排列。
我们可以利用一个字符串来代表绘图风格的缓冲模式,字母 D 代表数据缓冲器、字母 C 代表颜色缓冲器,从左到右对应索引编号的从小到大。
由此,MQL5 绘图风格的缓冲模式如下表所示:
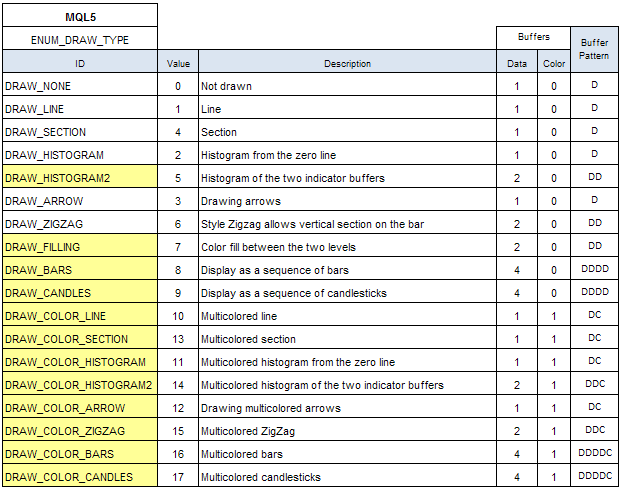
表 2. MQL5 绘图风格的“缓冲模式”
如果您的指标中有多个标绘,那么,该指标的缓冲模式就会按照这些标绘的缓冲模式的顺序排列,调用 SetIndexBuffer()时,缓冲索引应按升序排列。
如果您采用了计算必需的保存临时数据的辅助缓冲器,那么,这些辅助缓冲器都应与 SetIndexBuffer() 捆绑,且置于所有待显示的缓冲器的后面。
否则 ...
我发布了一个指标 DemoBufferPattern,用来演示缓冲模式。试一下吧。
我们一起来研究指标 DemoDrawType。
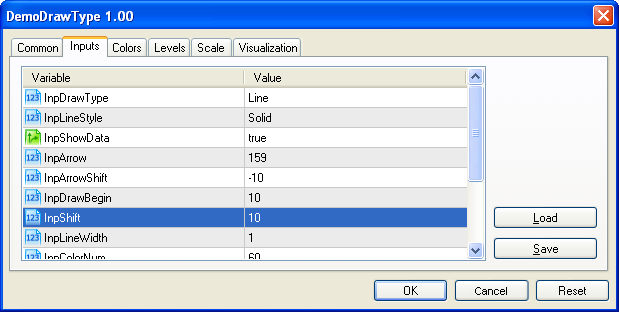
图 1. 指标输入参数
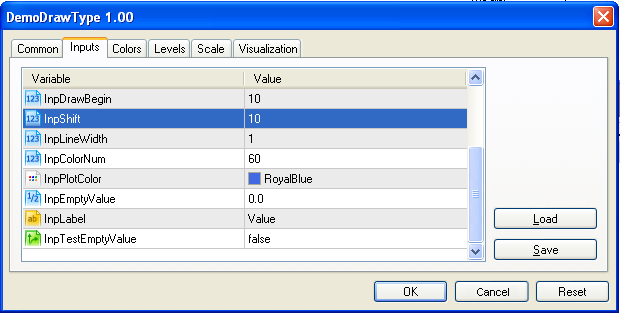
图 2. 指标输入参数(续)
它允许您从 "Inputs" (输入)选项卡选择任何绘图风格,并设置各种标绘属性。
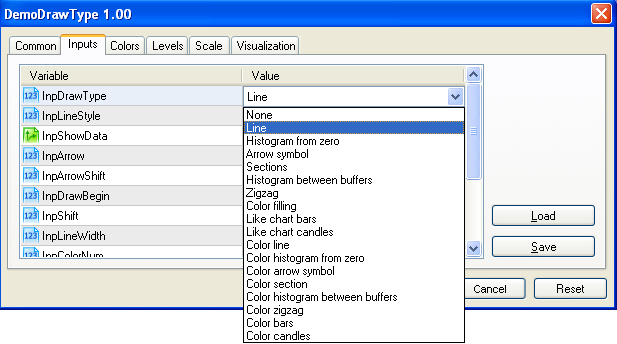
图 3. 绘图风格列表
因此,我们需要针对每个属性定义一个输入变量,并实现一个函数来检查这些变量的合理性。
由于输入变量不能在程序中修改,所以还需要定义一组全局变量来保留已检查的输入变量值。
//--- 输入参数
input ENUM_DRAW_TYPE InpDrawType    = DRAW_LINE;
input ENUM_LINE_STYLE InpLineStyle  = STYLE_SOLID;
input bool InpShowData        = true;
input uchar InpArrow          = 159;
input int InpArrowShift       = -10;
input int InpDrawBegin        = 10;
input int InpShift            = 10;
input int InpLineWidth        = 1;
input int InpColorNum         = 60;
input color InpPlotColor      = RoyalBlue;
input double InpEmptyValue    = 0.0;
input string InpLabel         = "Value";
input bool InpTestEmptyValue  = false;

//注: 全局范围声明变量不能在客户端混淆
//全局变量可用 GlobalVariable...() 函数存取.
//--- 您不能在代码中改变输入参数, 所以您需要全局变量
ENUM_DRAW_TYPE iDrawType      = DRAW_LINE;
ENUM_LINE_STYLE iLineStyle    = STYLE_SOLID;
bool bShowData       = true;
uchar uArrow         = 181;
int iArrowShift      = -10;
int iDrawBegin       = 10;
int iShift           = 10;
int iLineWidth       = 1;
int iColorNum        = 60;
color iPlotColor     = RoyalBlue;
string sLabel        = "";
bool bTestEmptyValue = false;
double dEmptyValue   = EMPTY_VALUE;

//+------------------------------------------------------------------
//| 检查输入参数。                                          |
//+------------------------------------------------------------------
bool checkInput()
  {
   if(InpDrawType<DRAW_NONE || InpDrawType>DRAW_COLOR_CANDLES) return(false);
   else iDrawType = InpDrawType;
   if(InpLineStyle<STYLE_SOLID || InpLineStyle>STYLE_DASHDOTDOT) return(false);
   else iLineStyle = InpLineStyle;
   bShowData   = InpShowData;
   uArrow      = InpArrow;    //如果 uArrow>255, MQL5 将设置箭头代码为 uArrow%256
   iArrowShift = InpArrowShift;
   iDrawBegin  = InpDrawBegin;
   iShift      = InpShift;
   iLineWidth  = InpLineWidth;
   iColorNum   = InpColorNum;
   iPlotColor  = InpPlotColor;
   //如果(InpEmptyValue<=0.0) dEmptyValue=0.0;
   //另外dEmptyValue=EMPTY_VALUE;
   dEmptyValue = InpEmptyValue;  // 它可能不是 0.0 或 EMPTY_VALUE
   sLabel      = InpLabel;
   bTestEmptyValue = InpTestEmptyValue;
   return(true);
  }
全部 18 种绘图风格的示例请见图 4-21:
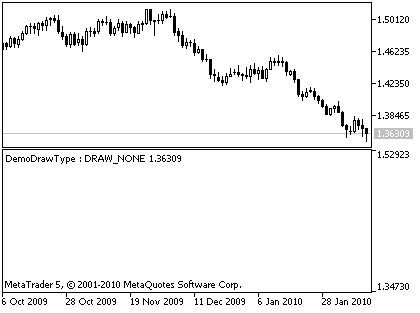
图 4. DRAW_NONE 绘图风格示例
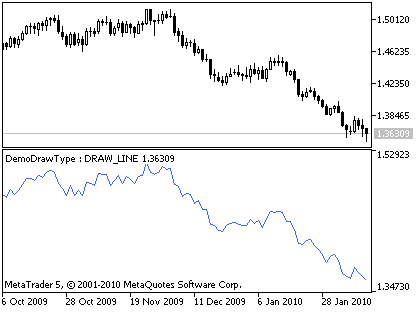
图 5. DRAW_LINE 绘图风格示例
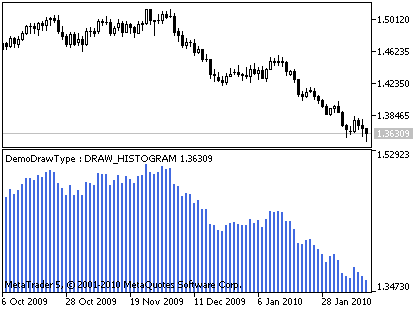
图 6. DRAW_HISTOGRAM 绘图风格示例
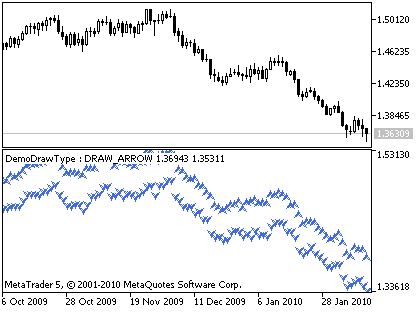
图 7. DRAW_ARROW 绘图风格示例
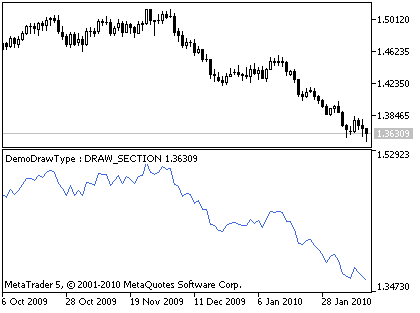
图 8. DRAW_SECTION 绘图风格示例
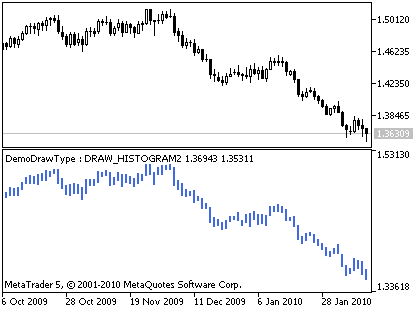
图 9. DRAW_HISTOGRAM2 绘图风格示例
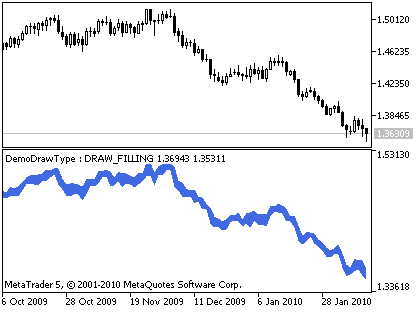
图 10. DRAW_FILLING 绘图风格示例
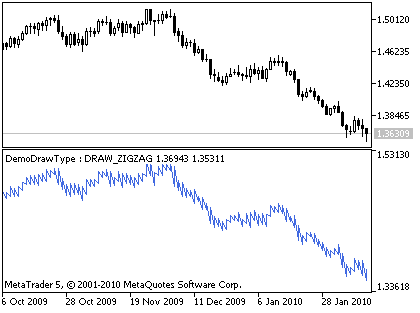
图 11. DRAW_ZIGZAG 绘图风格示例
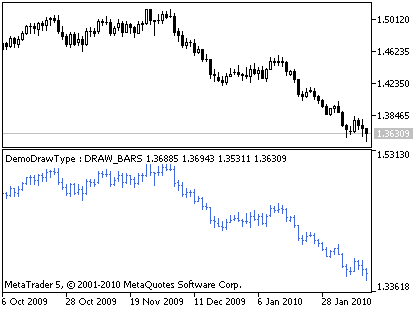
图 12. DRAW_BARS 绘图风格示例
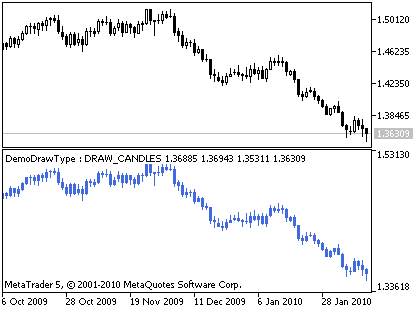
图 13. DRAW_CANDLES 绘图风格示例
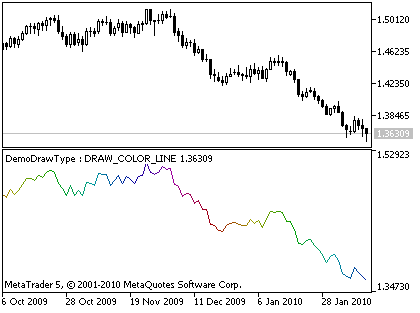
图 14. DRAW_COLOR_LINE 绘图风格示例
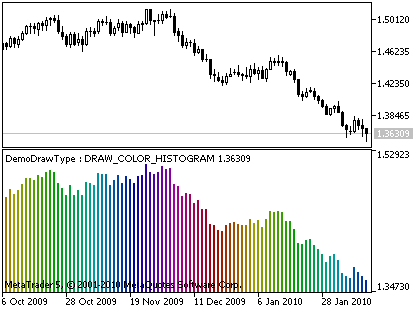
图 15. DRAW_COLOR_HISTOGRAM 绘图风格示例
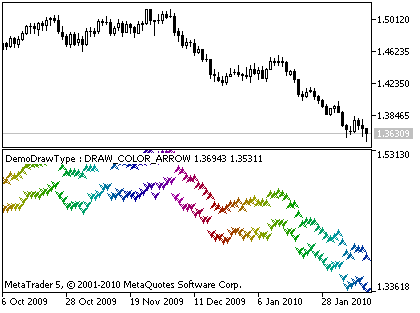
图 16. DRAW_COLOR_ARROW 绘图风格示例
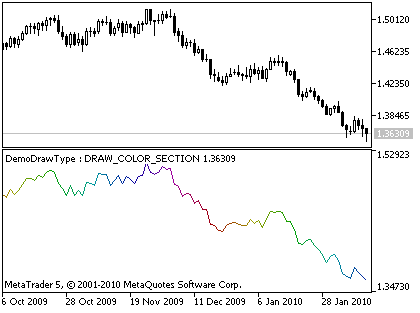
图 17. DRAW_COLOR_SECTION 绘图风格示例
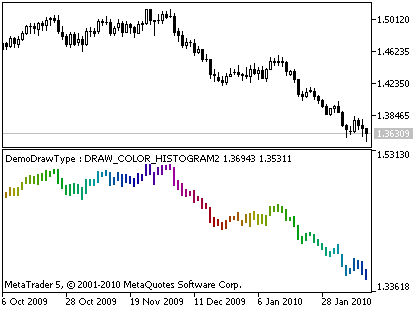
图 18. DRAW_COLOR_HISTOGRAM2 绘图风格示例
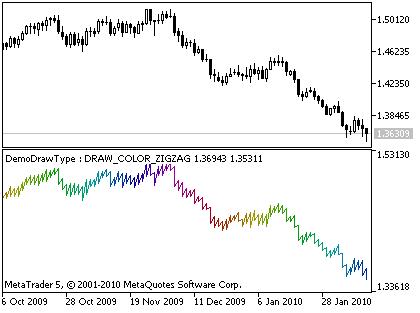
图 19. DRAW_COLOR_ZIGZAG 绘图风格示例
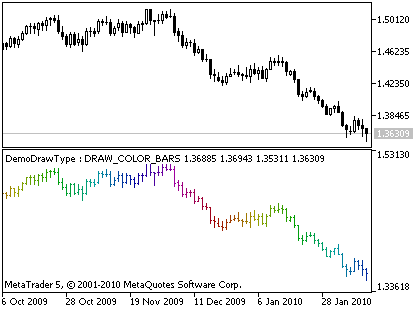
图 20. DRAW_COLOR_BARS 绘图风格示例
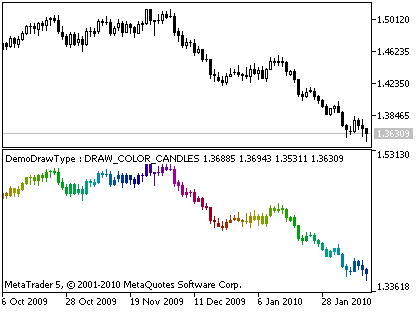
图 21. DRAW_COLOR_CANDLES 绘图风格示例
不同的绘图风格会呈现出不同的图表,所以它们要求不同的缓冲模式。
除了不同的缓冲模式外,各个绘图风格间的最大差别即在于其处理空值的方式。
所以我添加了一个允许您插入一个空值的输入参数。因为该指标的目的是要演示 DrawType,所以,只是一次性地设置部分空值。
根据处理空值的差异,可将全部绘图风格划分为三类:

表 3.分类划分的绘图风格
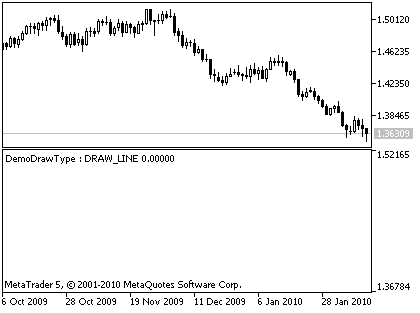
图 22. DRAW_LINE (带空值)绘图风格示例
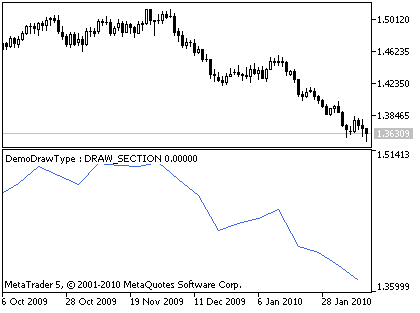
图 23. DRAW_SECTION (带空值)绘图风格示例
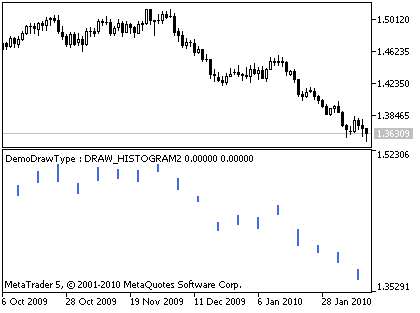
图 24. DRAW_HISTOGRAM2 (带空值)绘图风格示例
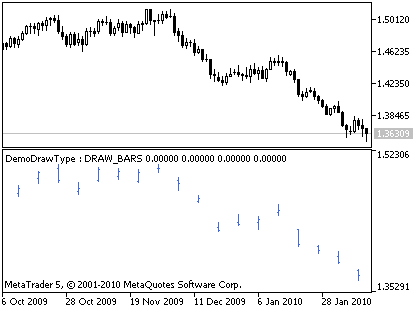
图 25. DRAW_BARS (带空值)绘图风格示例
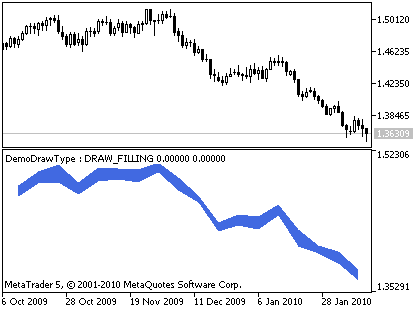
图 26. DRAW_FILLING (带空值)绘图风格示例
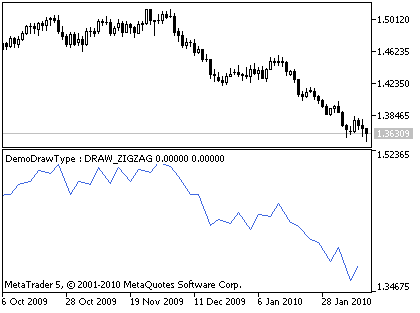
图 27. DRAW_ZIGZAG (带空值)绘图风格示例
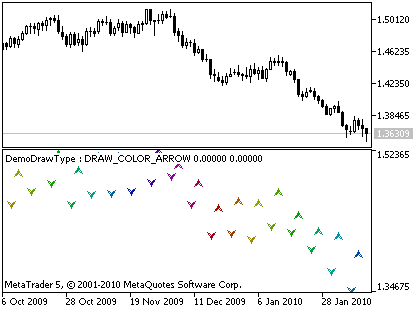
图 28. DRAW_COLOR_ARROW (带空值)绘图风格示例
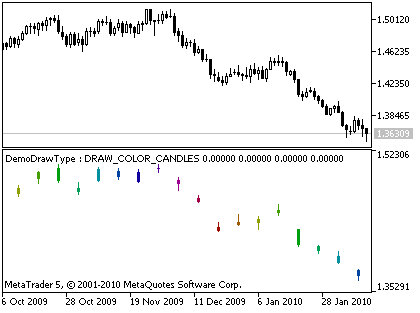
图 29. DRAW_COLOR_CANDLES (带空值)绘图风格示例
该指标的完整源代码:
//+------------------------------------------------------------------
//|                                                 DemoDrawType.mq5 |
//|                             Copyright 2010, Loong@forum.mql4.com |
//|                             http://login.mql5.com/en/users/Loong |
//+------------------------------------------------------------------
#property copyright "2010, Loong@forum.mql4.com"
#property link      "http://login.mql5.com/en/users/Loong"
#property version   "1.00"

//#property indicator_chart_window
#property indicator_separate_window // 为了显示更清楚
#property indicator_plots   1 //必须设置, 可以大于实际需要, 但不能大于 indicator_buffers
#property indicator_buffers 5 //必须设置, 可以大于实际需要
//+------------------------------------------------------------------
//| 绘制类型结构,有关绘制类型的记录信息和缓冲模式   |
//+------------------------------------------------------------------
struct SLoongDrawType                       // 绘图类型
  {
   ENUM_DRAW_TYPE    eDrawType;             // 绘图类型枚举
   int               iDrawType;             // 绘图类型值, 仅用于看
   int               iNumBufferData;        // 数据缓存区数量
   int               iNumBufferColor;       // 颜色缓存区数量
   string            sDrawType;             // 绘图类型字符串
   string            sDrawTypeDescription;  // 绘图类型描述,从文档中复制
  };
//+------------------------------------------------------------------
//| 常量数组,有关绘制类型的记录信息和缓冲模式       |
//+------------------------------------------------------------------
const SLoongDrawType caDrawType[]=
  {
     { DRAW_NONE,              0,    1,    0,    "DRAW_NONE",             "不画" },
     { DRAW_LINE,              1,    1,    0,    "DRAW_LINE",             "线" },
     { DRAW_HISTOGRAM,         2,    1,    0,    "DRAW_HISTOGRAM",        "从0轴开始的柱状线" },
     { DRAW_ARROW,             3,    1,    0,    "DRAW_ARROW",            "画箭头" },
     { DRAW_SECTION,           4,    1,    0,    "DRAW_SECTION",          "线段" },
     { DRAW_HISTOGRAM2,        5,    2,    0,    "DRAW_HISTOGRAM2",       "两个缓存区数值间柱状线" },
     { DRAW_ZIGZAG,            6,    2,    0,    "DRAW_ZIGZAG",           "折线允许柱线上画垂直线段" },
     { DRAW_FILLING,           7,    2,    0,    "DRAW_FILLING",          "两个水平线间填色" },
     { DRAW_BARS,              8,    4,    0,    "DRAW_BARS",             "显示柱线序列" },
     { DRAW_CANDLES,           9,    4,    0,    "DRAW_CANDLES",          "显示蜡烛线序列" },
     { DRAW_COLOR_LINE,       10,    1,    1,    "DRAW_COLOR_LINE",       "多色线" },
     { DRAW_COLOR_HISTOGRAM,  11,    1,    1,    "DRAW_COLOR_HISTOGRAM",  "多色从0轴开始的柱状线" },
     { DRAW_COLOR_ARROW,      12,    1,    1,    "DRAW_COLOR_ARROW",      "画多色箭头" },
     { DRAW_COLOR_SECTION,    13,    1,    1,    "DRAW_COLOR_SECTION",    "多色线段" },
     { DRAW_COLOR_HISTOGRAM2, 14,    2,    1,    "DRAW_COLOR_HISTOGRAM2", "多色两个缓存区数值间柱状线" },
     { DRAW_COLOR_ZIGZAG,     15,    2,    1,    "DRAW_COLOR_ZIGZAG",     "多色折线" },
     { DRAW_COLOR_BARS,       16,    4,    1,    "DRAW_COLOR_BARS",       "多色柱线" },
     { DRAW_COLOR_CANDLES,    17,    4,    1,    "DRAW_COLOR_CANDLES",    "多色蜡烛线" }
  };

//--- 输入参数
input ENUM_DRAW_TYPE InpDrawType    = DRAW_LINE;
input ENUM_LINE_STYLE InpLineStyle  = STYLE_SOLID;
input bool InpShowData        = true;
input uchar InpArrow          = 159;
input int InpArrowShift       = -10;
input int InpDrawBegin        = 10;
input int InpShift            = 10;
input int InpLineWidth        = 1;
input int InpColorNum         = 60;
input color InpPlotColor      = RoyalBlue;
input double InpEmptyValue    = 0.0;
input string InpLabel         = "Value";
input bool InpTestEmptyValue  = false;

//注: 全局范围声明变量不能在客户端混淆
// 全局变量可用 GlobalVariable...() 函数存取.
//--- 您不能在代码中改变输入参数, 所以您需要全局变量
ENUM_DRAW_TYPE iDrawType      = DRAW_LINE;
ENUM_LINE_STYLE iLineStyle    = STYLE_SOLID;
bool bShowData       = true;
uchar uArrow         = 181;
int iArrowShift      = -10;
int iDrawBegin       = 10;
int iShift           = 10;
int iLineWidth       = 1;
int iColorNum        = 60;
color iPlotColor     = RoyalBlue;
string sLabel        = "";
bool bTestEmptyValue = false;
double dEmptyValue   = EMPTY_VALUE;

//--- 指标缓冲
double DC[];   // 颜色缓存区
double D1[];   //  数据缓存区
double D2[];
double D3[];
double D4[];
//+------------------------------------------------------------------
//| 检查输入参数。                                          |
//+------------------------------------------------------------------
bool checkInput()
  {
   if(InpDrawType<DRAW_NONE || InpDrawType>DRAW_COLOR_CANDLES) return(false);
   else iDrawType=InpDrawType;
   if(InpLineStyle<STYLE_SOLID || InpLineStyle>STYLE_DASHDOTDOT) return(false);
   else iLineStyle=InpLineStyle;
   bShowData   =InpShowData;
   uArrow=InpArrow;    //如果 uArrow>255, MQL5 将设置箭头代码为 uArrow%256
   iArrowShift = InpArrowShift;
   iDrawBegin  = InpDrawBegin;
   iShift      = InpShift;
   iLineWidth  = InpLineWidth;
   iColorNum   = InpColorNum;
   iPlotColor  = InpPlotColor;
//如果(InpEmptyValue<=0.0) dEmptyValue=0.0;
//另外dEmptyValue=EMPTY_VALUE;
   dEmptyValue=InpEmptyValue;  // 它可能不是 0.0 或 EMPTY_VALUE
   sLabel=InpLabel;
   bTestEmptyValue=InpTestEmptyValue;
   return(true);
  }
//+------------------------------------------------------------------
//| 颜色平均                                           |
//+------------------------------------------------------------------
int ColorInc6section(int i,int iBase=63,int iI=0xFF)
  {
   int id  = (int)MathFloor((double)iBase/6.0);
   int ip  = (int)MathFloor((double)iI/id);
   int MA_Rinc=0;
   int MA_Ginc=0;
   int MA_Binc=0;
   color iColor=0;
   if(i<=0)        {iColor =       iI; MA_Rinc=0; MA_Ginc=0; MA_Binc=0;}
   else if(i<1*id) {iColor =       iI; MA_Rinc=  0; MA_Ginc= ip; MA_Binc=  0;}
   else if(i<2*id) {iColor =   257*iI; MA_Rinc=-ip; MA_Ginc=  0; MA_Binc=  0;}
   else if(i<3*id) {iColor =   256*iI; MA_Rinc=  0; MA_Ginc=  0; MA_Binc= ip;}
   else if(i<4*id) {iColor = 65792*iI; MA_Rinc=  0; MA_Ginc=-ip; MA_Binc=  0;}
   else if(i<5*id) {iColor = 65536*iI; MA_Rinc= ip; MA_Ginc=  0; MA_Binc=  0;}
   else if(i<6*id) {iColor = 65537*iI; MA_Rinc=  0; MA_Ginc=  0; MA_Binc=-ip;}
   else            {iColor =       iI; MA_Rinc=  0; MA_Ginc=  0; MA_Binc=  0;}
   int iColorInc=(MA_Rinc+256*MA_Ginc+65536*MA_Binc);
   return iColor+iColorInc*(i%id);
  }
//+------------------------------------------------------------------
//| 设置标绘颜色索引                                           |
//+------------------------------------------------------------------
void SetPlotColorIndexes(int plot_index)
  {
   int iIllumination=0xFF;
//color cBack=(color)ChartGetInteger(0,CHART_COLOR_BACKGROUND);
//Print("背景是 ",cBack);
//if(White==cBack) iIllumination=0x9F; //打算得到更佳视觉效果
   PlotIndexSetInteger(plot_index,PLOT_COLOR_INDEXES,iColorNum);
   for(int i=0;i<iColorNum;i++)
      PlotIndexSetInteger(plot_index,PLOT_LINE_COLOR,i,ColorInc6section(i,iColorNum,iIllumination));
  }
//+------------------------------------------------------------------
//| 设置标绘类型和其他属性                          |
//+------------------------------------------------------------------
bool SetPlotProperties()
  {
//Print("iDrawType="+iDrawType);
   PlotIndexSetInteger(0,PLOT_DRAW_TYPE,iDrawType);
   PlotIndexSetInteger(0,PLOT_LINE_STYLE,iLineStyle);
   PlotIndexSetInteger(0,PLOT_SHIFT,iShift);
   PlotIndexSetInteger(0,PLOT_SHOW_DATA,bShowData);//--- 如果显示指标数据在数据窗口
   PlotIndexSetInteger(0,PLOT_DRAW_BEGIN,iDrawBegin);
   PlotIndexSetInteger(0,PLOT_LINE_WIDTH,iLineWidth);
   PlotIndexSetDouble(0,PLOT_EMPTY_VALUE,dEmptyValue);
   PlotIndexSetString(0,PLOT_LABEL,sLabel);
   switch(iDrawType) //            数据  颜色
     {
      case DRAW_COLOR_ARROW:       //1,    1,
         SetIndexBuffer(0,D1,INDICATOR_DATA);
         SetIndexBuffer(1,DC,INDICATOR_COLOR_INDEX);
         PlotIndexSetInteger(0,PLOT_ARROW,uArrow);
         PlotIndexSetInteger(0,PLOT_ARROW_SHIFT,iArrowShift);
         SetPlotColorIndexes(0);
         break;

      case DRAW_ARROW:             //1,    0,
         SetIndexBuffer(0,D1,INDICATOR_DATA);
         PlotIndexSetInteger(0,PLOT_ARROW,uArrow);
         PlotIndexSetInteger(0,PLOT_ARROW_SHIFT,iArrowShift);
         PlotIndexSetInteger(0,PLOT_LINE_COLOR,iPlotColor);
         break;

      case DRAW_COLOR_LINE:        //1,    1,
      case DRAW_COLOR_HISTOGRAM:   //1,    1,
      case DRAW_COLOR_SECTION:     //1,    1,
         SetIndexBuffer(0,D1,INDICATOR_DATA);
         SetIndexBuffer(1,DC,INDICATOR_COLOR_INDEX);
         SetPlotColorIndexes(0);
         break;

      case DRAW_NONE:              //1,    0,
      case DRAW_LINE:              //1,    0,
      case DRAW_HISTOGRAM:         //1,    0,
      case DRAW_SECTION:           //1,    0,
         SetIndexBuffer(0,D1,INDICATOR_DATA);
         PlotIndexSetInteger(0,PLOT_LINE_COLOR,iPlotColor);
         break;

      case DRAW_COLOR_HISTOGRAM2:  //2,    1,
      case DRAW_COLOR_ZIGZAG:      //2,    1,
         SetIndexBuffer(0,D1,INDICATOR_DATA);
         SetIndexBuffer(1,D2,INDICATOR_DATA);
         SetIndexBuffer(2,DC,INDICATOR_COLOR_INDEX);
         SetPlotColorIndexes(0);
         break;

      case DRAW_HISTOGRAM2:        //2,    0,
      case DRAW_ZIGZAG:            //2,    0,
         SetIndexBuffer(0,D1,INDICATOR_DATA);
         SetIndexBuffer(1,D2,INDICATOR_DATA);
         PlotIndexSetInteger(0,PLOT_LINE_COLOR,iPlotColor);
         break;

      case DRAW_FILLING:           //2,    0,
         SetIndexBuffer(0,D1,INDICATOR_DATA);
         SetIndexBuffer(1,D2,INDICATOR_DATA);
         PlotIndexSetInteger(0,PLOT_LINE_COLOR,iPlotColor);
         break;

      case DRAW_COLOR_BARS:        //4,    1,
      case DRAW_COLOR_CANDLES:     //4,    1,
         SetIndexBuffer(0,D1,INDICATOR_DATA);
         SetIndexBuffer(1,D2,INDICATOR_DATA);
         SetIndexBuffer(2,D3,INDICATOR_DATA);
         SetIndexBuffer(3,D4,INDICATOR_DATA);
         SetIndexBuffer(4,DC,INDICATOR_COLOR_INDEX);
         SetPlotColorIndexes(0);
         break;
      case DRAW_BARS:              //4,    0,
      case DRAW_CANDLES:           //4,    0,
         SetIndexBuffer(0,D1,INDICATOR_DATA);
         SetIndexBuffer(1,D2,INDICATOR_DATA);
         SetIndexBuffer(2,D3,INDICATOR_DATA);
         SetIndexBuffer(3,D4,INDICATOR_DATA);
         PlotIndexSetInteger(0,PLOT_LINE_COLOR,iPlotColor);
         break;
     }
   return(true);
  }
//+------------------------------------------------------------------
//| 自定义指标初始化函数                         |
//+------------------------------------------------------------------
int OnInit()
  {
//--- 数组初始化
   bool bInitBuffer=true;
   if(bInitBuffer)
     {
      ArrayInitialize(D1,dEmptyValue);
      ArrayInitialize(D2,dEmptyValue);
      ArrayInitialize(D3,dEmptyValue);
      ArrayInitialize(D4,dEmptyValue);
      ArrayInitialize(DC,dEmptyValue);
     }
   checkInput();
   SetPlotProperties();
//--- 设置精度
   IndicatorSetInteger(INDICATOR_DIGITS,_Digits);
   IndicatorSetString(INDICATOR_SHORTNAME,"演示绘图类型 : "+caDrawType[iDrawType].sDrawType);
   return(0);
  }
//+------------------------------------------------------------------
//| 自定义指标迭代函数                              |
//+------------------------------------------------------------------
int OnCalculate(const int rates_total,
                const int prev_calculated,
                const datetime &time[],
                const double &open[],
                const double &high[],
                const double &low[],
                const double &close[],
                const long &tick_volume[],
                const long &volume[],
                const int &spread[])
  {
//--- 辅助变量
   int i=0;
//--- 设置开始位置
   if(i<prev_calculated) i=prev_calculated-1;
//--- 开始计算
   while(i<rates_total)
     {
      switch(iDrawType) //            数据  颜色   如果(缓存区包括 EmptyValue)
        {
         case DRAW_COLOR_LINE:        //1,    1,      所有都不画
            DC[i]=(double)(i%iColorNum);
         case DRAW_LINE:              //1,    0,      所有都不画
         case DRAW_NONE:              //1,    0,      第一个不画
            if(bTestEmptyValue)
              {
               if(i%5==1)D1[i]=high[i];
               else D1[i]=dEmptyValue;
              }
            else
               D1[i]=close[i];
            break;

         case DRAW_COLOR_SECTION:     //1,    1,      连接两个非空值
            DC[i]=(double)(i%iColorNum);
         case DRAW_SECTION:           //1,    0,      连接相邻的非空值
            if(bTestEmptyValue)
              {
               if(i%5==1)D1[i]=close[i];
               else D1[i]=dEmptyValue;
              }
            else
               D1[i]=close[i];
            break;

         case DRAW_FILLING:           //2,    0,
            //DC[i]=(double)(i%iColorNum);
            if(bTestEmptyValue)
              {
               if(i%5==1)
                 {
                  D1[i]=high[i];
                  D2[i]=low[i];
                 }
               else
                 {
                  D1[i]=dEmptyValue;
                  D2[i]=dEmptyValue;
                 }
              }
            else
              {
               D1[i]=high[i];
               D2[i]=low[i];
              }
            break;

         case DRAW_COLOR_ZIGZAG:      //2,    1,
            DC[i]=(double)(i%iColorNum);
         case DRAW_ZIGZAG:            //2,    0,
            if(bTestEmptyValue)
              {
               if(i%5==1)D1[i]=high[i];
               else D1[i]=dEmptyValue;
               if(i%5==4)D2[i]=low[i];
               else D2[i]=dEmptyValue;
              }
            else
              {
               D1[i]=high[i];
               D2[i]=low[i];
              }
            break;

         case DRAW_COLOR_ARROW:       //1,    1,      在非空值处画箭头
         case DRAW_COLOR_HISTOGRAM:   //1,    1,      仅在非空值处画
            DC[i]=(double)(i%iColorNum);
         case DRAW_ARROW:             //1,    0,      在非空值处画箭头
         case DRAW_HISTOGRAM:         //1,    0,      仅在非空值处画
            if(bTestEmptyValue)
              {
               if(i%5==1)D1[i]=close[i];
               else D1[i]=dEmptyValue;
              }
            else
              {
               D1[i]=close[i];
              }
            break;

         case DRAW_COLOR_HISTOGRAM2:  //2,    1,      仅在非空值处画
            DC[i]=(double)(i%iColorNum);
         case DRAW_HISTOGRAM2:        //2,    0,      仅在非空值处画
            if(bTestEmptyValue)
              {
               if(i%5==1)
                 {
                  D1[i]=high[i];
                  D2[i]=low[i];
                 }
               else
                 {
                  D1[i]=dEmptyValue;
                  D2[i]=dEmptyValue;
                 }
              }
            else
              {
               D1[i]=high[i];
               D2[i]=low[i];
              }
            break;

         case DRAW_COLOR_BARS:        //4,    1,      仅在非空值处画
         case DRAW_COLOR_CANDLES:     //4,    1,      仅在非空值处画
            DC[i]=(double)(i%iColorNum);
         case DRAW_BARS:              //4,    0,      仅在非空值处画
         case DRAW_CANDLES:           //4,    0,      仅在非空值处画
            if(bTestEmptyValue)
              {
               if(i%5==1)
                 {
                  D1[i]=open[i];
                  D2[i]=high[i];
                  D3[i]=low[i];
                  D4[i]=close[i];
                 }
               else
                 {
                  D1[i]=dEmptyValue;
                  D2[i]=dEmptyValue;
                  D3[i]=dEmptyValue;
                  D4[i]=dEmptyValue;
                 }
              }
            else
              {
               D1[i]=open[i];
               D2[i]=high[i];
               D3[i]=low[i];
               D4[i]=close[i];
              }
            break;
        }
      //---
      i++;
     }
//--- 为下一次调用返回prev_calculated值
   return(rates_total);
  }
//+------------------------------------------------------------------
问:不能标绘任何东西。
答:该指标的目的是让您可以在不编写代码的情况下测试所有的绘图风格,所以如果您输入了错误的参数,它就不会标绘,不用大惊小怪。
问:caDrawType[] 看起来没什么用,它只用于获取 DrawType 的名称字符串吗?
答:好吧,我承认,确实是我犯懒了,它是我在其他地方借用的。caDrawType[] 在某些情况下还是非常有用的,我们会在接下来的文章中讨论。
您可以绘制您想绘制的任何东西。
愿代码与您同在。

本社区仅针对特定人员开放
查看需注册登录并通过风险意识测评
5秒后跳转登录页面...
移动端课程
