本文基于 John F. Ehlers 的两本著作:《交易者的火箭科学》 及 《股票与期货控制分析》。这种利用数字信号处理方法并采用复数数字的非同寻常的市场分析方法和市场周期识别,让我能够深入研究这一主题,并随后在 MQL5 中实施由 J.F.Ehlers 提出的三个自适应指标。
本文要讲述的是这些自适应指标背后的基础理论及其 MQL5 实施。而自适应指标则要同其非自适应的指标进行对比。
对于非工程背景的读者而言,复数理论的概念可能非常难以理解,因此,在阅读本文之前,我建议您到维基网站深入了解该理论并到 观看复数操作的相关视频。
相量
相量或相向量是一种显示周期幅度与相位的向量。根据 欧拉公式,一个正弦波可以表示为两个复数组件的和。请注意下方的一个描述正弦波周期的旋转相量。
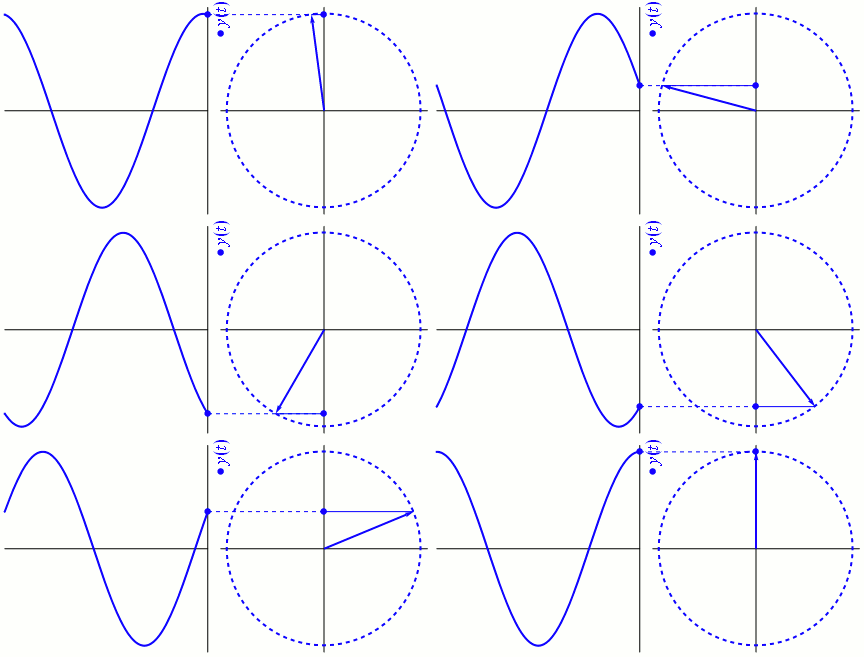
第一次观看该动画,您可能会对如何正确读取周期相关相量感到迷惑。想要理解,您必须要转变自己的思维方式:不要将周期看成是动画左侧可见的寻常波形,而应看成是右侧的旋转相量。
刚开始可能很难想像,但我找到了以此思考的一种方式:相量的全程旋转为 360 度或 ![]() 弧度,整个周期也是一样。相量的当前角度会指明我们所处的周期(相位)部分。Y 轴则会表示周期在某个给定相位中的幅度。
弧度,整个周期也是一样。相量的当前角度会指明我们所处的周期(相位)部分。Y 轴则会表示周期在某个给定相位中的幅度。
相量可细分为两个组件:同相组件(余弦)和正交组件(正弦)。上述组件衍生的详细阐述,请见 《交易者的火箭科学》书中的第 6 章:《希尔伯特变换》。如果有兴趣,请仔细阅读此章内容。
目前为止,您只需要关注这一事实:针对自适应指标计算,我们需要将解析信号(波形)转换为由两个组件组成的一个复数。如何才能实现这一点呢?我是不是提到过“希尔伯特变换”?嗯,没错。希尔伯特变换就是做这个的。
为了让“希尔伯特变换”对交易者实用,John Ehlers 在书中将“希尔伯特变换”系列截分成了四个部分。
正交组件的方程为:
![]()
而同相组件的方程则是延迟三个柱的价格:
![]()
完成同相组件与正交组件的计算后,即可能通过测定的当前柱相位角和测得的一柱之前的相位角,衍生出差分相位计算。当前柱的相位为![]() ,而前一柱的相位为
,而前一柱的相位为![]() 。使用三角恒等式:
。使用三角恒等式:
![]()
我们获得被称为 DeltaPhase 的差分相位方程。
Ehlers 先生为 DeltaPhase 变量增加了几个限制:结果不能为负,且 DeltaPhase 局限于 <0.1, 1.1> 弧度(意味着 6 柱到 63 柱之间的周期)。看起来根据真实数据测得的 DeltaPhase 噪音非常大,因此需要平滑。
针对突钉数据的最佳平滑方法为中值滤波器,由此会有五个 DeltaPhase 样本中值构成 MedianDelta 变量。用 MedianDelta 除以 ![]() 计算“主导周期”- 我们想要的市场周期。
计算“主导周期”- 我们想要的市场周期。
开发测试期间,其测量值呈现出 0.5 左右的乖离率,需要移除,并添加移除该乖离的补偿项。最后,“主导周期”被 EMA 分别利用 0.33 和 0.15 两个 alpha 值平滑两次。我强烈推荐阅读本书,以了解应用于某个循环周期从 6 渐增至 40 的正弦波的算法的可靠性。
掌握理论知识之后,我们就做好了在 MQL5 中实施 CyclePeriod 指标的准备。
该指标由两条线组成:显示循环周期的周期线,以及延迟一个柱、基本上亦是周期线的触发线。如果您遵从“测量循环周期”章节及 OnCalculate() 函数源代码中的描述,您就能轻松关联负责循环周期测量的线。
//+------------------------------------------------------------------+
//|                                                  CyclePeriod.mq5 |
//|                                      Copyright 2011, Investeo.pl |
//|                                               http://Investeo.pl |
//+------------------------------------------------------------------+
#property copyright "Copyright 2011, Investeo.pl"
#property link      "http://Investeo.pl"
#property version   "1.00"
#property indicator_separate_window

#property description "CyclePeriod 指标 - John F. Ehlers 在"
#property description " \"股票和期货的控制分析\"一书中介绍"

#property indicator_buffers 2
#property indicator_plots 2
#property indicator_width1 1
#property indicator_width2 1
#property indicator_type1   DRAW_LINE
#property indicator_type2   DRAW_LINE
#property indicator_color1  Green
#property indicator_color2  Red
#property indicator_label1  "Cycle"
#property indicator_label2  "Trigger Line"

#define Price(i) ((high[i]+low[i])/2.0)

double Smooth[];
double Cycle[];
double Trigger[];
//double Price[];
double Q1[]; // 积分组件
double I1[]; // 同相组件
double DeltaPhase[];
double InstPeriod[];
double CyclePeriod[];


input double InpAlpha=0.07; // alpha
//+------------------------------------------------------------------+
//| 自定义指标初始化函数                                                |
//+------------------------------------------------------------------+
int OnInit()
  {
//--- 指标缓冲区映射
   ArraySetAsSeries(Cycle,true);
   ArraySetAsSeries(CyclePeriod,true);
   ArraySetAsSeries(Trigger,true);
   ArraySetAsSeries(Smooth,true);
   //ArraySetAsSeries(Price,true);

   SetIndexBuffer(0,CyclePeriod,INDICATOR_DATA);
   SetIndexBuffer(1,Trigger,INDICATOR_DATA);

   PlotIndexSetDouble(0,PLOT_EMPTY_VALUE,0.0);
   PlotIndexSetDouble(1,PLOT_EMPTY_VALUE,0.0);

   return(0);
  }
//+------------------------------------------------------------------+
//| 自定义指标迭代函数                                                  |
//+------------------------------------------------------------------+
int OnCalculate(const int rates_total,
                const int prev_calculated,
                const datetime &time[],
                const double &open[],
                const double &high[],
                const double &low[],
                const double &close[],
                const long &tick_volume[],
                const long &volume[],
                const int &spread[])
  {
//---
   long tickCnt[1];
   int i;
   int ticks=CopyTickVolume(Symbol(), 0, 0, 1, tickCnt);
   if(ticks!=1) return(rates_total);
   double DC, MedianDelta;

   Comment(tickCnt[0]);

   if(prev_calculated==0 || tickCnt[0]==1)
     {
      //--- 最近计数的柱将被重新计数
      int nLimit=rates_total-prev_calculated-1; // 计算起点索引

      ArraySetAsSeries(high,true);
      ArraySetAsSeries(low,true);

      ArrayResize(Smooth,Bars(_Symbol,_Period));
      ArrayResize(Cycle,Bars(_Symbol,_Period));
      //ArrayResize(Price,Bars(_Symbol,_Period));
      ArrayResize(CyclePeriod,Bars(_Symbol,_Period));
      ArrayResize(InstPeriod,Bars(_Symbol,_Period));
      ArrayResize(Q1,Bars(_Symbol,_Period));
      ArrayResize(I1,Bars(_Symbol,_Period));
      ArrayResize(DeltaPhase,Bars(_Symbol,_Period));

      if (nLimit>rates_total-7) // 为最近的柱做调整
         nLimit=rates_total-7;

      for(i=nLimit;i>=0 && !IsStopped();i--)
      {
         Smooth[i] = (Price(i)+2*Price(i+1)+2*Price(i+2)+Price(i+3))/6.0;

         if (i<rates_total-7)
         {
            Cycle[i] = (1.0-0.5*InpAlpha) * (1.0-0.5*InpAlpha) * (Smooth[i]-2.0*Smooth[i+1]+Smooth[i+2])
                      +2.0*(1.0-InpAlpha)*Cycle[i+1]-(1.0-InpAlpha)*(1.0-InpAlpha)*Cycle[i+2];

         } else
         {
            Cycle[i]=(Price(i)-2.0*Price(i+1)+Price(i+2))/4.0;
         }

         Q1[i] = (0.0962*Cycle[i]+0.5769*Cycle[i+2]-0.5769*Cycle[i+4]-0.0962*Cycle[i+6])*(0.5+0.08*InstPeriod[i+1]);
         I1[i] = Cycle[i+3];

         if (Q1[i]!=0.0 && Q1[i+1]!=0.0)
            DeltaPhase[i] = (I1[i]/Q1[i]-I1[i+1]/Q1[i+1])/(1.0+I1[i]*I1[i+1]/(Q1[i]*Q1[i+1]));
         if (DeltaPhase[i] < 0.1)
            DeltaPhase[i] = 0.1;
         if (DeltaPhase[i] > 0.9)
            DeltaPhase[i] = 0.9;

         MedianDelta = Median(DeltaPhase, i, 5);

         if (MedianDelta == 0.0)
            DC = 15.0;
         else
            DC = (6.28318/MedianDelta) + 0.5;

         InstPeriod[i] = 0.33 * DC + 0.67 * InstPeriod[i+1];
         CyclePeriod[i] = 0.15 * InstPeriod[i] + 0.85 * CyclePeriod[i+1];
         Trigger[i] = CyclePeriod[i+1];
      }
     }
//--- 返回 prev_calculated 值用于下次调用
   return(rates_total);
  }
//+------------------------------------------------------------------+

double Median(double& arr[], int idx, int m_len)
{
   double MedianArr[];
   int copied;
   double result = 0.0;

   ArraySetAsSeries(MedianArr, true);
   ArrayResize(MedianArr, m_len);

   copied = ArrayCopy(MedianArr, arr, 0, idx, m_len);
   if (copied == m_len)
   {
      ArraySort(MedianArr);
      if (m_len %2 == 0)
            result = (MedianArr[m_len/2] + MedianArr[(m_len/2)+1])/2.0;
      else
            result = MedianArr[m_len / 2];

   }
   else Print(__FILE__+__FUNCTION__+"中值错误 - 复制元素数目错误.");
   return result;
}
我们可以将其附加至任何图表来测试 - 适用于任何安全性及时间表。
请参见下方屏幕截图。
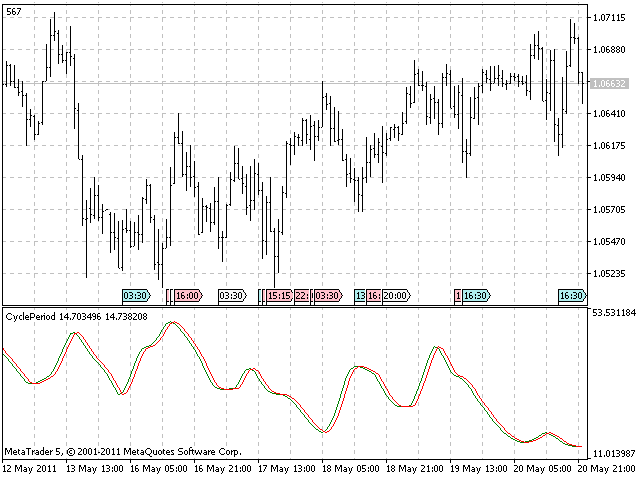
工作空间内有了这个指标,我们就能够实施一种新型的自适应指标 - 调整以适应市场某当前循环周期的指标。
循环周期指标是一种高通滤波器,取自 《股票与期货控制分析》。该滤波器只留下来自时间序列的周期模式组件。
更多的两柱与三柱周期组件,均通过 有限脉冲响应低通滤波器进行平滑的结果提取。
为此专用的指标 MQL5 代码及本文中其他指标,均改编自该书中描述的 EFL (Tradestation) 语言。
//+------------------------------------------------------------------+
//|                                                   CyberCycle.mq5 |
//|                                      Copyright 2011, Investeo.pl |
//|                                               http://Investeo.pl |
//+------------------------------------------------------------------+
#property copyright "Copyright 2011, Investeo.pl"
#property link      "http://Investeo.pl"
#property version   "1.00"
#property indicator_separate_window

#property description "CyberCycle 指标 - 由 John F. Ehlers 在"
#property description " \"股票和期货的控制分析\"一书中介绍"
#property description "本指标可以免费下载."

#property indicator_buffers 2
#property indicator_plots 2
#property indicator_width1 1
#property indicator_width2 1
#property indicator_type1   DRAW_LINE
#property indicator_type2   DRAW_LINE
#property indicator_color1  Green
#property indicator_color2  Red
#property indicator_label1  "Cycle"
#property indicator_label2  "Trigger Line"

#define Price(i) ((high[i]+low[i])/2.0)

double Smooth[];
double Cycle[];
double Trigger[];

input double InpAlpha=0.07; // alpha
//+------------------------------------------------------------------+
//| 自定义指标初始化函数                                                |
//+------------------------------------------------------------------+
int OnInit()
  {
//--- 指标缓冲区映射
   ArraySetAsSeries(Cycle,true);
   ArraySetAsSeries(Trigger,true);
   ArraySetAsSeries(Smooth,true);

   SetIndexBuffer(0,Cycle,INDICATOR_DATA);
   SetIndexBuffer(1,Trigger,INDICATOR_DATA);

   PlotIndexSetDouble(0,PLOT_EMPTY_VALUE,0.0);
   PlotIndexSetDouble(1,PLOT_EMPTY_VALUE,0.0);

   return(0);
  }
//+------------------------------------------------------------------+
//| 自定义指标迭代函数                                                  |
//+------------------------------------------------------------------+
int OnCalculate(const int rates_total,
                const int prev_calculated,
                const datetime &time[],
                const double &open[],
                const double &high[],
                const double &low[],
                const double &close[],
                const long &tick_volume[],
                const long &volume[],
                const int &spread[])
  {
//---
   long tickCnt[1];
   int i;
   int ticks=CopyTickVolume(Symbol(), 0, 0, 1, tickCnt);
   if(ticks!=1) return(rates_total);

   Comment(tickCnt[0]);

   if(prev_calculated==0 || tickCnt[0]==1)
     {
      //--- 最近计数的柱将被重新计数
      int nLimit=rates_total-prev_calculated-1; // 计算起点索引

      ArraySetAsSeries(high,true);
      ArraySetAsSeries(low,true);

      ArrayResize(Smooth,Bars(_Symbol,_Period));
      ArrayResize(Cycle,Bars(_Symbol,_Period));

      if(nLimit>rates_total-4) // 为最新的柱做调整
         nLimit=rates_total-4;

      for(i=nLimit;i>=0 && !IsStopped();i--)
        {
         Smooth[i]=(Price(i)+2*Price(i+1)+2*Price(i+2)+Price(i+3))/6.0;

         if(i<rates_total-5)
           {
            Cycle[i]=(1.0-0.5*InpAlpha) *(1.0-0.5*InpAlpha) *(Smooth[i]-2.0*Smooth[i+1]+Smooth[i+2])
                     +2.0*(1.0-InpAlpha)*Cycle[i+1]-(1.0-InpAlpha)*(1.0-InpAlpha)*Cycle[i+2];
           }
         else
           {
            Cycle[i]=(Price(i)-2.0*Price(i+1)+Price(i+2))/4.0;
           }

         //Print(__FILE__+__FUNCTION__+" 接收数值: ",rCnt);
         Trigger[i]=Cycle[i+1];
        }
     }
//--- 返回 prev_calculated 值用于下次调用
   return(rates_total);
  }
//+------------------------------------------------------------------+
指标的屏幕截图已粘贴如下。
您可能注意到了,本文中的所有指标外观都相似,但其实施的算法却有很大差异 。
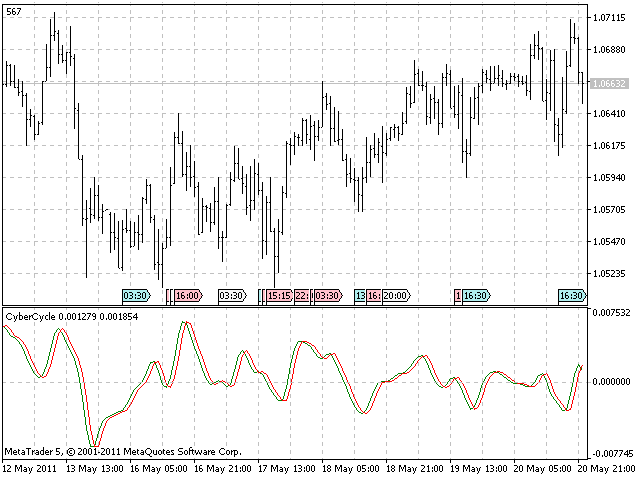
该指标最初的交易方法很直接:在周期线上穿触发线时买入。在周期线下穿触发线时卖出。您可能想(也建议您)利用该指标实施自己的策略和交易信号模块。
本文的主旨在于说明如何让指标能够自适应,也就是,如何利用动态循环周期输入代替静态设置来计算它们。为此,我们必须连接到 CyclePeriod 指标以读取当前周期,之后再将该读数用于 OnCalculate() 函数中。
首先,我们需要获取指标的句柄:
hCyclePeriod=iCustom(NULL,0,"CyclePeriod",InpAlpha);
   if(hCyclePeriod==INVALID_HANDLE)
     {
      Print("CyclePeriod 指标不可用!");
      return(-1);
     }
然后再于 OnCalculate() 函数内读取它:
int copied=CopyBuffer(hCyclePeriod,0,i,1,CyclePeriod);
    if(copied<=0)
      {
       Print("失败: 无法从 CyclePeriod 指标中取得数据.");
       return -1;
      }
alpha1 = 2.0/(CyclePeriod[0]+1.0);
指数移动 alpha 与通过方程 ![]() 得出的简单移动平均线的长度相关,在“自适应数码周期”指标中,Ehlers 是将“主导循环”周期作为 Alpha1 系数计算中的长度。
得出的简单移动平均线的长度相关,在“自适应数码周期”指标中,Ehlers 是将“主导循环”周期作为 Alpha1 系数计算中的长度。
下面是完整的源代码:
//+------------------------------------------------------------------+
//|                                           AdaptiveCyberCycle.mq5 |
//|                                      Copyright 2011, Investeo.pl |
//|                                               http://Investeo.pl |
//+------------------------------------------------------------------+
#property copyright "Copyright 2011, Investeo.pl"
#property link      "http://Investeo.pl"
#property version   "1.00"
#property indicator_separate_window

#property description "自适应 CyberCycle 指标 - 由 John F. Ehlers 在"
#property description " \"股票和期货的控制分析\"一书中介绍"
#property description "本指标可以免费下载."

#property indicator_buffers 2
#property indicator_plots 2
#property indicator_width1 1
#property indicator_width2 1
#property indicator_type1   DRAW_LINE
#property indicator_type2   DRAW_LINE
#property indicator_color1  Green
#property indicator_color2  Red
#property indicator_label1  "Cycle"
#property indicator_label2  "Trigger Line"

#define Price(i) ((high[i]+low[i])/2.0)

double Smooth[];
double Cycle[];
double Trigger[];

int hCyclePeriod;

input double InpAlpha=0.07; // 循环周期的 alpha
//+------------------------------------------------------------------+
//| 自定义指标初始化函数                                                |
//+------------------------------------------------------------------+
int OnInit()
  {
//--- 指标缓冲区映射
   ArraySetAsSeries(Cycle,true);
   ArraySetAsSeries(Trigger,true);
   ArraySetAsSeries(Smooth,true);

   SetIndexBuffer(0,Cycle,INDICATOR_DATA);
   SetIndexBuffer(1,Trigger,INDICATOR_DATA);

   PlotIndexSetDouble(0,PLOT_EMPTY_VALUE,0.0);
   PlotIndexSetDouble(1,PLOT_EMPTY_VALUE,0.0);

   hCyclePeriod=iCustom(NULL,0,"CyclePeriod",InpAlpha);
   if(hCyclePeriod==INVALID_HANDLE)
     {
      Print("CyclePeriod 指标不可用!");
      return(-1);
     }
   return(0);
  }
//+------------------------------------------------------------------+
//| 自定义指标迭代函数                                                  |
//+------------------------------------------------------------------+
int OnCalculate(const int rates_total,
                const int prev_calculated,
                const datetime &time[],
                const double &open[],
                const double &high[],
                const double &low[],
                const double &close[],
                const long &tick_volume[],
                const long &volume[],
                const int &spread[])
  {
//---
   long tickCnt[1];
   int i;
   int ticks=CopyTickVolume(Symbol(), 0, 0, 1, tickCnt);
   if(ticks!=1) return(rates_total);
   double CyclePeriod[1],alpha1;

   Comment(tickCnt[0]);

   if(prev_calculated==0 || tickCnt[0]==1)
     {
      //--- 最近计数的柱将被重新计数
      int nLimit=rates_total-prev_calculated-1; // 计算起点索引

      ArraySetAsSeries(high,true);
      ArraySetAsSeries(low,true);

      ArrayResize(Smooth,Bars(_Symbol,_Period));
      ArrayResize(Cycle,Bars(_Symbol,_Period));

      if(nLimit>rates_total-4) // 为最新的柱做调整
         nLimit=rates_total-4;

      for(i=nLimit;i>=0 && !IsStopped();i--)
        {
         Smooth[i]=(Price(i)+2*Price(i+1)+2*Price(i+2)+Price(i+3))/6.0;
         int copied=CopyBuffer(hCyclePeriod,0,i,1,CyclePeriod);

         if(copied<=0)
           {
            Print("失败: 无法从 CyclePeriod 指标中取得数据.");
            return -1;
           }
         alpha1 = 2.0/(CyclePeriod[0]+1.0);
         //Print(alpha1);
         //Print(CyclePeriod[0]);
         if(i>=0)
           {
            Cycle[i]=(1.0-0.5*alpha1) *(1.0-0.5*alpha1) *(Smooth[i]-2.0*Smooth[i+1]+Smooth[i+2])
                     +2.0*(1.0-alpha1)*Cycle[i+1]-(1.0-alpha1)*(1.0-alpha1)*Cycle[i+2];

            //Print("Smooth["+IntegerToString(i)+"]="+DoubleToString(Smooth[i])+" Cycle["+IntegerToString(i)+"]="+DoubleToString(Cycle[i]));
           }
         else
           {
            Cycle[i]=(Price(i)-2.0*Price(i+1)+Price(i+2))/4.0;
           }

         //Print(__FILE__+__FUNCTION__+" 接收数值: ",rCnt);
         Trigger[i]=Cycle[i+1];
        }
     }
//--- 返回 prev_calculated 值用于下次调用
   return(rates_total);
  }
//+------------------------------------------------------------------+
请参见随附屏幕截图中的指标。
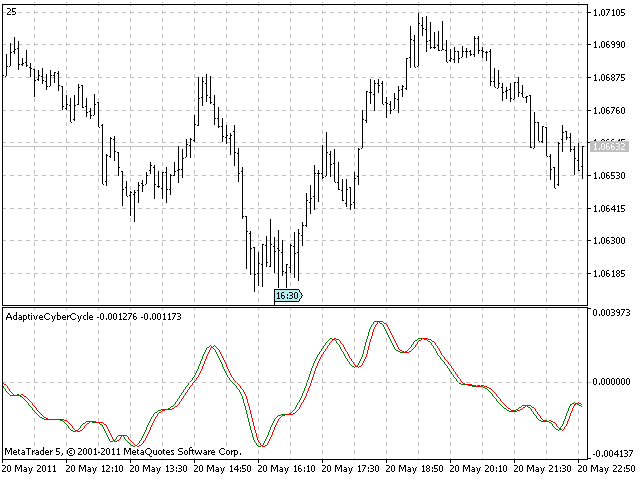
我们的第一个自适应指标已准备就绪。按书中所说,它应该比非自适应的版本响应性更好。
与非自适应版本相比,买入和卖出信号通常要早一个柱发生。
我们再继续介绍两个指标示例,这样就足够您弄清楚创建自适应指标的方案了。
我们所说的任何实体对象的重心,都是指其平衡点。将此概念引入交易的想法,来自于对各种过滤器与过滤器系数关联延迟方式的观察。
对于 SMA - 简单移动平均线而言,所有系数均相等,重心在中间。
对于WMA - 加权移动平均线而言,最新价格要比旧的价格重要。具体来讲,就是 WMA 的系数会描绘三角形的轮廓。三角形的重心位于三角形底边三分之一长度处。为计算某给定观测窗上重心而衍生的更具一般性的方程如下:

平衡点的位置,是位于窗内的持仓产品总和,乘以该持仓的价格(方程中引入 +1,因为我们计数是从 0 到 N,而不是从 1 到 N),再除以窗内价格总和。
重心指标的主要特性在于,它会随着价格摆减小和增大,且实质上是一个零延迟动量指标。
源代码如下:
//+------------------------------------------------------------------+
//|                                              CenterOfGravity.mq5 |
//|                                      Copyright 2011, Investeo.pl |
//|                                               http://Investeo.pl |
//+------------------------------------------------------------------+
#property copyright "Copyright 2011, Investeo.pl"
#property link      "http://Investeo.pl"
#property version   "1.00"
#property indicator_separate_window

#property description "重心指标 - 由 John F. Ehlers 在"
#property description " \"股票和期货的控制分析\"一书中介绍"
#property description "本指标可以免费下载."

#property indicator_buffers 2
#property indicator_plots 2
#property indicator_width1 1
#property indicator_width2 1
#property indicator_type1   DRAW_LINE
#property indicator_type2   DRAW_LINE
#property indicator_color1  Green
#property indicator_color2  Red
#property indicator_label1  "Cycle"
#property indicator_label2  "Trigger Line"

#define Price(i) ((high[i]+low[i])/2.0)

double Smooth[];
double Cycle[];
double Trigger[];

input double InpAlpha=0.07; // alpha
input int InpCGLength=10; //重心指标窗口尺寸

//+------------------------------------------------------------------+
//| 自定义指标初始化函数                                                |
//+------------------------------------------------------------------+
int OnInit()
  {
//--- 指标缓冲区映射
   ArraySetAsSeries(Cycle,true);
   ArraySetAsSeries(Trigger,true);
   ArraySetAsSeries(Smooth,true);

   SetIndexBuffer(0,Cycle,INDICATOR_DATA);
   SetIndexBuffer(1,Trigger,INDICATOR_DATA);

   PlotIndexSetDouble(0,PLOT_EMPTY_VALUE,0.0);
   PlotIndexSetDouble(1,PLOT_EMPTY_VALUE,0.0);

   return(0);
  }
//+------------------------------------------------------------------+
//| 自定义指标迭代函数                                                  |
//+------------------------------------------------------------------+
int OnCalculate(const int rates_total,
                const int prev_calculated,
                const datetime &time[],
                const double &open[],
                const double &high[],
                const double &low[],
                const double &close[],
                const long &tick_volume[],
                const long &volume[],
                const int &spread[])
  {
//---
   long tickCnt[1];
   int i;
   double Num, Denom; // 重心指标 的分子和分母
   int ticks=CopyTickVolume(Symbol(), 0, 0, 1, tickCnt);
   if(ticks!=1) return(rates_total);

   Comment(tickCnt[0]);

   if(prev_calculated==0 || tickCnt[0]==1)
     {
      //--- 最近计数的柱将被重新计数
      int nLimit=rates_total-prev_calculated-1; // 计算起点索引

      ArraySetAsSeries(high,true);
      ArraySetAsSeries(low,true);

      ArrayResize(Smooth,Bars(_Symbol,_Period));
      ArrayResize(Cycle,Bars(_Symbol,_Period));

      if(nLimit>rates_total-InpCGLength) // 为最近的柱做调整
         nLimit=rates_total-InpCGLength;

      for(i=nLimit;i>=0 && !IsStopped();i--)
        {
         Num = 0.0;
         Denom = 0.0;
         for (int count=0; count<InpCGLength; count++)
            {
               Num += (1.0+count)*Price(i+count);
               Denom += Price(i+count);
            }
         if (Denom != 0.0)
            Cycle[i] = -Num/Denom+(InpCGLength+1.0)/2.0;
         else
            Cycle[i] = 0.0;

         //Print(__FILE__+__FUNCTION__+" 接收数值: ",rCnt);
         Trigger[i]=Cycle[i+1];
        }
     }
//--- 返回 prev_calculated 值用于下次调用
   return(rates_total);
  }
//+------------------------------------------------------------------+
下方为屏幕截图。请注意小延迟。
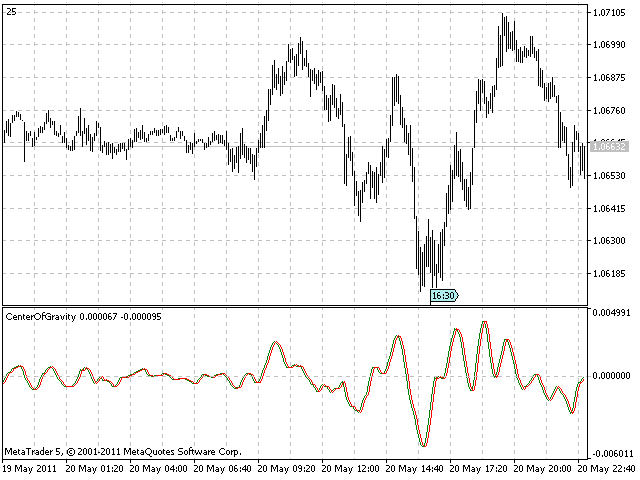
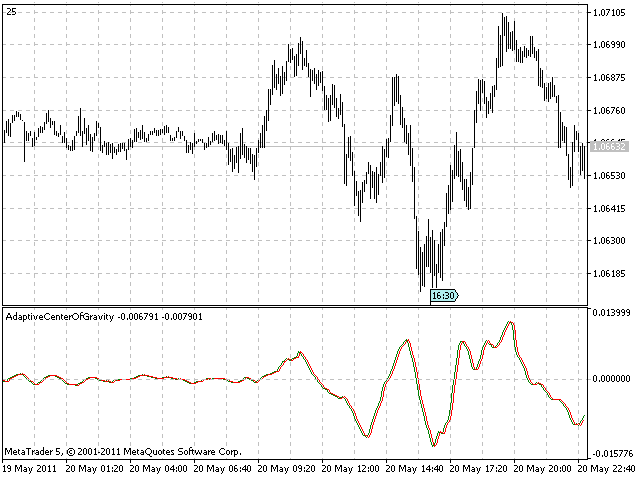
重心动量指标会查找某固定长度时间窗口上的重心。自适应重心动量指标会将“主导循环”周期测得值的一半,作为动态窗口长度。想要提取“主导循环”周期测得值的一半,则使用下述代码。
copied=CopyBuffer(hCyclePeriod,0,i,1,CyclePeriod);

if(copied<=0)
  {
   Print("失败: 无法从 CyclePeriod 指标中取得数据.");
   return -1;
  }
CG_len = floor(CyclePeriod[0]/2.0);
请找到下方的完整指标源代码,并比较其与非自适应型及“自适应数码指标”有无类似之处。
//+------------------------------------------------------------------+
//|                                      AdaptiveCenterOfGravity.mq5 |
//|                                      Copyright 2011, Investeo.pl |
//|                                               http://Investeo.pl |
//+------------------------------------------------------------------+
#property copyright "Copyright 2011, Investeo.pl"
#property link      "http://Investeo.pl"
#property version   "1.00"
#property indicator_separate_window

#property description "自适应重心指标 - 由 John F. Ehlers 在"
#property description " \"股票和期货的控制分析\"一书中介绍"
#property description "本指标可以免费下载."

#property indicator_buffers 2
#property indicator_plots 2
#property indicator_width1 1
#property indicator_width2 1
#property indicator_type1   DRAW_LINE
#property indicator_type2   DRAW_LINE
#property indicator_color1  Green
#property indicator_color2  Red
#property indicator_label1  "Cycle"
#property indicator_label2  "Trigger Line"

#define Price(i) ((high[i]+low[i])/2.0)

double Smooth[];
double Cycle[];
double Trigger[];

int hCyclePeriod;

input double InpAlpha=0.07; // alpha
//+------------------------------------------------------------------+
//| 自定义指标初始化函数                                                |
//+------------------------------------------------------------------+
int OnInit()
  {
//--- 指标缓冲区映射
   ArraySetAsSeries(Cycle,true);
   ArraySetAsSeries(Trigger,true);
   ArraySetAsSeries(Smooth,true);

   SetIndexBuffer(0,Cycle,INDICATOR_DATA);
   SetIndexBuffer(1,Trigger,INDICATOR_DATA);

   PlotIndexSetDouble(0,PLOT_EMPTY_VALUE,0.0);
   PlotIndexSetDouble(1,PLOT_EMPTY_VALUE,0.0);

   hCyclePeriod=iCustom(NULL,0,"CyclePeriod",InpAlpha);
   if(hCyclePeriod==INVALID_HANDLE)
     {
      Print("CyclePeriod 指标不可用!");
      return(-1);
     }

   return(0);
  }
//+------------------------------------------------------------------+
//| 自定义指标迭代函数                                                  |
//+------------------------------------------------------------------+
int OnCalculate(const int rates_total,
                const int prev_calculated,
                const datetime &time[],
                const double &open[],
                const double &high[],
                const double &low[],
                const double &close[],
                const long &tick_volume[],
                const long &volume[],
                const int &spread[])
  {
//---
   long tickCnt[1];
   int i, copied;
   double Num,Denom; // 重心指标的分子和分母
   double CG_len;
   int ticks=CopyTickVolume(Symbol(), 0, 0, 1, tickCnt);
   if(ticks!=1) return(rates_total);
   double CyclePeriod[1];

   Comment(tickCnt[0]);

   if(prev_calculated==0 || tickCnt[0]==1)
     {
      //--- 最近计数的柱将被重新计数
      int nLimit=rates_total-prev_calculated-1; // 计算起点索引

      ArraySetAsSeries(high,true);
      ArraySetAsSeries(low,true);

      ArrayResize(Smooth,Bars(_Symbol,_Period));
      ArrayResize(Cycle,Bars(_Symbol,_Period));

      copied=CopyBuffer(hCyclePeriod,0,0,1,CyclePeriod);

      if(copied<=0)
        {
         Print("失败: 无法从 CyclePeriod 指标中取得数据.");
         return -1;
        }

      if(nLimit>rates_total-int(CyclePeriod[0])-2) // 为最近的柱做调整
         nLimit=rates_total-int(CyclePeriod[0])-2;


      for(i=nLimit;i>=0 && !IsStopped();i--)
        {
         copied=CopyBuffer(hCyclePeriod,0,i,1,CyclePeriod);

         if(copied<=0)
           {
            Print("失败: 无法从 CyclePeriod 指标中取得数据.");
            return -1;
           }
         CG_len = floor(CyclePeriod[0]/2.0);
         //Print("CG_len="+DoubleToString(CG_len));

         Num=0.0;
         Denom=0.0;
         for(int count=0; count<int(CG_len); count++)
           {
            Num+=(1.0+count)*Price(i+count);
            Denom+=Price(i+count);
           }
         if(Denom!=0.0)
            Cycle[i]=-Num/Denom+(CG_len+1.0)/2.0;
         else
            Cycle[i]=0.0;

         //Print(__FILE__+__FUNCTION__+" 接收数值: ",rCnt);
         Trigger[i]=Cycle[i+1];
        }
     }
//--- 返回 prev_calculated 值用于下次调用
   return(rates_total);
  }
//+------------------------------------------------------------------+
请注意下方粘贴的自适应重心指标屏幕截图。
RVI 代表的是相对能量指数 (Relative Vigor Index)。此指标背后的理念是:牛市中价格倾向于收盘价高于开盘价,而熊市中则倾向于收盘价低于开盘价。
而移动的能量,则通过收盘价与开盘价相对于每日交易范围的差异测得。

MetaTrader 的许多用户都对该指标相当熟悉,因为它现在已经嵌入到了 MetaTrader 5 安装当中。
我还是把源代码贴出来,以供参考:
//+------------------------------------------------------------------+
//|                                                          RVI.mq5 |
//|                        Copyright 2009, MetaQuotes Software Corp. |
//|                                              https://www.mql5.com |
//+------------------------------------------------------------------+
#property copyright   "2009, MetaQuotes Software Corp."
#property link        "https://www.mql5.com"
#property description "相对能量指数 (RVI)"
//--- 指标设置
#property indicator_separate_window
#property indicator_buffers 2
#property indicator_plots   2
#property indicator_type1   DRAW_LINE
#property indicator_type2   DRAW_LINE
#property indicator_color1  Green
#property indicator_color2  Red
#property indicator_label1  "RVI"
#property indicator_label2  "Signal"
//--- 输入参数
input int InpRVIPeriod=10; // 周期数
//--- 指标缓冲区
double    ExtRVIBuffer[];
double    ExtSignalBuffer[];
//---
#define TRIANGLE_PERIOD  3
#define AVERAGE_PERIOD   (TRIANGLE_PERIOD*2)
//+------------------------------------------------------------------+
//| 自定义指标初始化函数                                                |
//+------------------------------------------------------------------+
void OnInit()
  {
//--- 指标缓冲区映射
   SetIndexBuffer(0,ExtRVIBuffer,INDICATOR_DATA);
   SetIndexBuffer(1,ExtSignalBuffer,INDICATOR_DATA);
   IndicatorSetInteger(INDICATOR_DIGITS,3);
//--- 设置需要绘出的第一个柱的索引
   PlotIndexSetInteger(0,PLOT_DRAW_BEGIN,(InpRVIPeriod-1)+TRIANGLE_PERIOD);
   PlotIndexSetInteger(1,PLOT_DRAW_BEGIN,(InpRVIPeriod-1)+AVERAGE_PERIOD);
//--- 数据窗口名称以及指标子窗口标签
   IndicatorSetString(INDICATOR_SHORTNAME,"RVI("+string(InpRVIPeriod)+")");
   PlotIndexSetString(0,PLOT_LABEL,"RVI("+string(InpRVIPeriod)+")");
   PlotIndexSetString(1,PLOT_LABEL,"Signal("+string(InpRVIPeriod)+")");
//--- 初始化完成
  }
//+------------------------------------------------------------------+
//| 相对能量指数                                                       |
//+------------------------------------------------------------------+
int OnCalculate(const int rates_total,const int prev_calculated,
                const datetime &Time[],
                const double &Open[],
                const double &High[],
                const double &Low[],
                const double &Close[],
                const long &TickVolume[],
                const long &Volume[],
                const int &Spread[])
  {
   int    i,j,nLimit;
   double dValueUp,dValueDown,dNum,dDeNum;
//--- 检查柱数
   if(rates_total<=InpRVIPeriod+AVERAGE_PERIOD+2) return(0); // 退出返回0
//--- 检查可能的错误
   if(prev_calculated<0) return(0); // 退出返回0
//--- 最近计数的柱将要重新计数
   nLimit=InpRVIPeriod+2;
   if(prev_calculated>InpRVIPeriod+TRIANGLE_PERIOD+2)
      nLimit=prev_calculated-1;
//--- 为没有计算的柱设置空值
   if(prev_calculated==0)
     {
      for(i=0;i<InpRVIPeriod+TRIANGLE_PERIOD;i++) ExtRVIBuffer[i]=0.0;
      for(i=0;i<InpRVIPeriod+AVERAGE_PERIOD;i++)  ExtSignalBuffer[i]=0.0;
     }
//--- RVI 在第一个缓冲区做计数
   for(i=nLimit;i<rates_total && !IsStopped();i++)
     {
      dNum=0.0;
      dDeNum=0.0;
      for(j=i;j>i-InpRVIPeriod;j--)
        {
         dValueUp=Close[j]-Open[j]+2*(Close[j-1]-Open[j-1])+2*(Close[j-2]-Open[j-2])+Close[j-3]-Open[j-3];
         dValueDown=High[j]-Low[j]+2*(High[j-1]-Low[j-1])+2*(High[j-2]-Low[j-2])+High[j-3]-Low[j-3];
         dNum+=dValueUp;
         dDeNum+=dValueDown;
        }
      if(dDeNum!=0.0)
         ExtRVIBuffer[i]=dNum/dDeNum;
      else
         ExtRVIBuffer[i]=dNum;
     }
//--- 信号线在第二个缓冲区做计数
   nLimit=InpRVIPeriod+TRIANGLE_PERIOD+2;
   if(prev_calculated>InpRVIPeriod+AVERAGE_PERIOD+2)
      nLimit=prev_calculated-1;
   for(i=nLimit;i<rates_total && !IsStopped();i++)
      ExtSignalBuffer[i]=(ExtRVIBuffer[i]+2*ExtRVIBuffer[i-1]+2*ExtRVIBuffer[i-2]+ExtRVIBuffer[i-3])/AVERAGE_PERIOD;

//--- OnCalculate 完成. 返回新的prev_calculated.
   return(rates_total);
  }
//+------------------------------------------------------------------+
下面粘贴的是一个周期已设为默认值 10 的标准 RVI 指标。
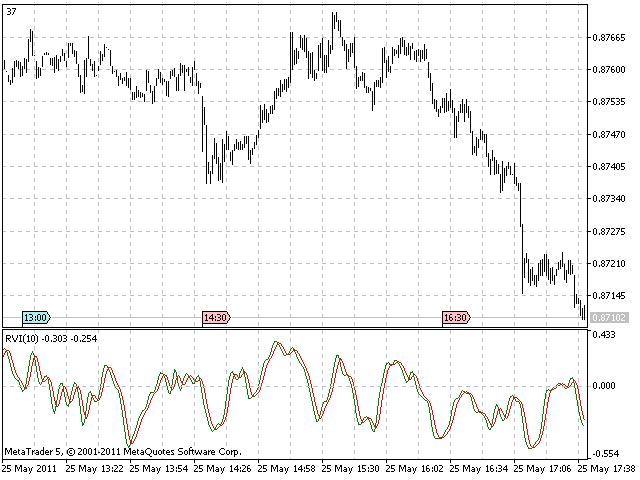
就和前两个自适应指标一样,我们需要由 CyclePeriod 指标提取“主导周期”测量值,并将其应用于 RVI 周期。"Length" 变量会作为周期的一个四柱加权移动平均线进行计算:
copied=CopyBuffer(hCyclePeriod,0,0,4,CyclePeriod);

if(copied<=0)
  {
   Print("失败: 无法从 CyclePeriod 指标中取得数据.");
   return -1;
  }
AdaptiveRVIPeriod = int(floor((4*CyclePeriod[0]+3*CyclePeriod[1]+2*CyclePeriod[2]+CyclePeriod[3])/20.0));
请于下方找出自适应 RVI 指标的完整源代码。
//+------------------------------------------------------------------+
//|                                                 Adaptive RVI.mq5 |
//|                        Based on RVI by MetaQuotes Software Corp. |
//|                        Copyright 2009, MetaQuotes Software Corp. |
//|                                              https://www.mql5.com |
//+------------------------------------------------------------------+
#property copyright   "2009, MetaQuotes Software Corp."
#property copyright   "2011, Adaptive version Investeo.pl"
#property link        "https://www.mql5.com"
#property description "自适应相对能量指数(Adaptive RVI)"
//--- 指标设置
#property indicator_separate_window
#property indicator_buffers 2
#property indicator_plots   2
#property indicator_type1   DRAW_LINE
#property indicator_type2   DRAW_LINE
#property indicator_color1  Green
#property indicator_color2  Red
#property indicator_label1  "AdaptiveRVI"
#property indicator_label2  "Signal"

#define Price(i) ((high[i]+low[i])/2.0)

//--- 输入参数
input int InpRVIPeriod=10; // 初始  RVI 周期数
//--- 指标缓冲区
double    ExtRVIBuffer[];
double    ExtSignalBuffer[];
//---
int hCyclePeriod;
input double InpAlpha=0.07; // 循环周期的 alpha
int AdaptiveRVIPeriod;

#define TRIANGLE_PERIOD  3
#define AVERAGE_PERIOD   (TRIANGLE_PERIOD*2)
//+------------------------------------------------------------------+
//| 自定义指标初始化函数                                                |
//+------------------------------------------------------------------+
int OnInit()
  {
//--- 指标缓冲区映射
   SetIndexBuffer(0,ExtRVIBuffer,INDICATOR_DATA);
   SetIndexBuffer(1,ExtSignalBuffer,INDICATOR_DATA);
   IndicatorSetInteger(INDICATOR_DIGITS,3);
   hCyclePeriod=iCustom(NULL,0,"CyclePeriod",InpAlpha);
   if(hCyclePeriod==INVALID_HANDLE)
     {
      Print("CyclePeriod 指标不可用!");
      return(-1);
     }

//--- 设置需要绘出的第一个柱的索引
   PlotIndexSetInteger(0,PLOT_DRAW_BEGIN,(InpRVIPeriod-1)+TRIANGLE_PERIOD);
   PlotIndexSetInteger(1,PLOT_DRAW_BEGIN,(InpRVIPeriod-1)+AVERAGE_PERIOD);
//--- 数据窗口名称以及指标子窗口标签
   IndicatorSetString(INDICATOR_SHORTNAME,"AdaptiveRVI");
   PlotIndexSetString(0,PLOT_LABEL,"AdaptiveRVI");
   PlotIndexSetString(1,PLOT_LABEL,"Signal");
//--- 初始化完成
  return 0;
  }
//+------------------------------------------------------------------+
//| 相对能量指数                                                       |
//+------------------------------------------------------------------+
int OnCalculate(const int rates_total,const int prev_calculated,
                const datetime &Time[],
                const double &Open[],
                const double &High[],
                const double &Low[],
                const double &Close[],
                const long &TickVolume[],
                const long &Volume[],
                const int &Spread[])
  {
   int    i,j,nLimit;
   double dValueUp,dValueDown,dNum,dDeNum;
   double CyclePeriod[4];
   int copied;

   copied=CopyBuffer(hCyclePeriod,0,0,4,CyclePeriod);

         if(copied<=0)
           {
            Print("失败: 无法从 CyclePeriod 指标中取得数据.");
            return -1;
           }
   AdaptiveRVIPeriod = int(floor((4*CyclePeriod[0]+3*CyclePeriod[1]+2*CyclePeriod[2]+CyclePeriod[3])/20.0));
//--- 检查柱数
   if(rates_total<=AdaptiveRVIPeriod+AVERAGE_PERIOD+2) return(0); // 退出返回0
//--- 检查可能的错误
   if(prev_calculated<0) return(0); // 退出返回0
//--- 最近计数的柱将要重新计数
   nLimit=AdaptiveRVIPeriod+2;
   if(prev_calculated>AdaptiveRVIPeriod+TRIANGLE_PERIOD+2)
      nLimit=prev_calculated-1;
//--- 为没有计算的柱设置空值
   if(prev_calculated==0)
     {
      for(i=0;i<AdaptiveRVIPeriod+TRIANGLE_PERIOD;i++) ExtRVIBuffer[i]=0.0;
      for(i=0;i<AdaptiveRVIPeriod+AVERAGE_PERIOD;i++)  ExtSignalBuffer[i]=0.0;
     }
//--- RVI 在第一个缓冲区做计数
   for(i=nLimit;i<rates_total && !IsStopped();i++)
     {
      copied=CopyBuffer(hCyclePeriod,0,rates_total-i-1,4,CyclePeriod);

         if(copied<=0)
           {
            Print("失败: 无法从 CyclePeriod 指标中取得数据.");
            return -1;
           }
      AdaptiveRVIPeriod = int(floor((4*CyclePeriod[0]+3*CyclePeriod[1]+2*CyclePeriod[2]+CyclePeriod[3])/20.0));
      dNum=0.0;
      dDeNum=0.0;
      for(j=i;j>MathMax(i-AdaptiveRVIPeriod, 3);j--)
        {
         //Print("rates_total="+IntegerToString(rates_total)+" nLimit="+IntegerToString(nLimit)+
         //      " AdaptiveRVIPeriod="+IntegerToString(AdaptiveRVIPeriod)+" j="+IntegerToString(j));
         dValueUp=Close[j]-Open[j]+2*(Close[j-1]-Open[j-1])+2*(Close[j-2]-Open[j-2])+Close[j-3]-Open[j-3];
         dValueDown=High[j]-Low[j]+2*(High[j-1]-Low[j-1])+2*(High[j-2]-Low[j-2])+High[j-3]-Low[j-3];
         dNum+=dValueUp;
         dDeNum+=dValueDown;
        }
      if(dDeNum!=0.0)
         ExtRVIBuffer[i]=dNum/dDeNum;
      else
         ExtRVIBuffer[i]=dNum;
     }
//--- 信号线在第二个缓冲区做计数
   nLimit=AdaptiveRVIPeriod+TRIANGLE_PERIOD+2;
   if(prev_calculated>AdaptiveRVIPeriod+AVERAGE_PERIOD+2)
      nLimit=prev_calculated-1;
   for(i=nLimit;i<rates_total && !IsStopped();i++)
    ExtSignalBuffer[i]=(ExtRVIBuffer[i]+2*ExtRVIBuffer[i-1]+2*ExtRVIBuffer[i-2]+ExtRVIBuffer[i-3])/AVERAGE_PERIOD;

//--- OnCalculate 完成. 返回新的prev_calculated.
   return(rates_total);
  }
//+------------------------------------------------------------------+
带有动态窗口长度的自适应 RVI 指标截图:
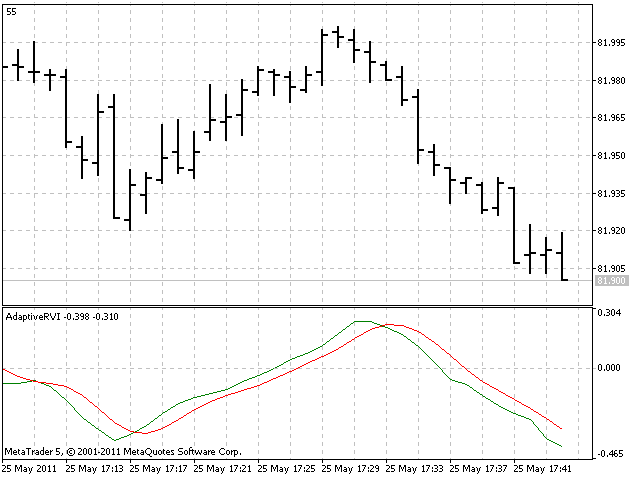
本文讲述了三种自适应技术指标行为及 MQL5 实施。
阅毕此文,也就清楚了自适应指标的实施机制。文中所述所有指标,附件中均有提供。
作者建议通过现有的自适应指标尝试和构建其他自适应指标。

本社区仅针对特定人员开放
查看需注册登录并通过风险意识测评
5秒后跳转登录页面...
移动端课程
