文章 点数图指标 和 Kagi 制图指标 描述了 点数图 和 "Kagi" 指标制图的原理。让我们来学习一种创建 图表的编程方式。
这个名字 "Renko" 是来自日本的一个词 "红砖",一种砖块。Renko 图表由一系列价格波动确定的砖块构建。当价格上涨, 一块向上的砖块放置在图表中, 当下跌则加一块向下的砖块。"Renko" 在日语中是 "步调缓慢" 的意思。此 Renko 图表大概是在 19 世纪出现在日本的某处。在美国和欧洲首次听到它,是在 1994,由 Steeve Nison 发表在他的书中 Beyond Candlesticks: New Japanese Charting Techniques - 超越蜡烛条: 新日本制图技术揭密。
此 Renko 图表如以上提及的那样,忽略了时间线,并只关注价格走势。不像点数图图表, 此 Renko 在新柱线中放置一块 "砖块" (在新的垂直平面), 其余的, 它们有通用创建方法: "砖块" 尺寸 ("点", "轮廓") 已经固定, 价格分析以及内在轮廓都用同样方式制作。
所以, Renko 图表是一组垂直柱线 ("砖块")。白色 (空心) 砖块用在趋势向上的时候, 而黑色 (实心) 砖块用在趋势下降时。构建由价格行为调整。取周期当前价格,与前一块砖的最高和最低比较 (白色或黑色)。如果股票收盘价高于它的开盘价, 绘制一块空心 (白色) 砖,其呈现出的实体底部是开盘价,实体顶部是收盘价。如果股票收盘价低于它的开盘价, 绘制一块实心 (黑色) 砖,其呈现出的实体顶部是开盘价,实体底部是收盘价。
图表的首块砖,依据价格行为绘制, 其柱线的开盘价取自前一块砖的最大最小值。
一个标准 Renko 图表的例子, 图例. 1:
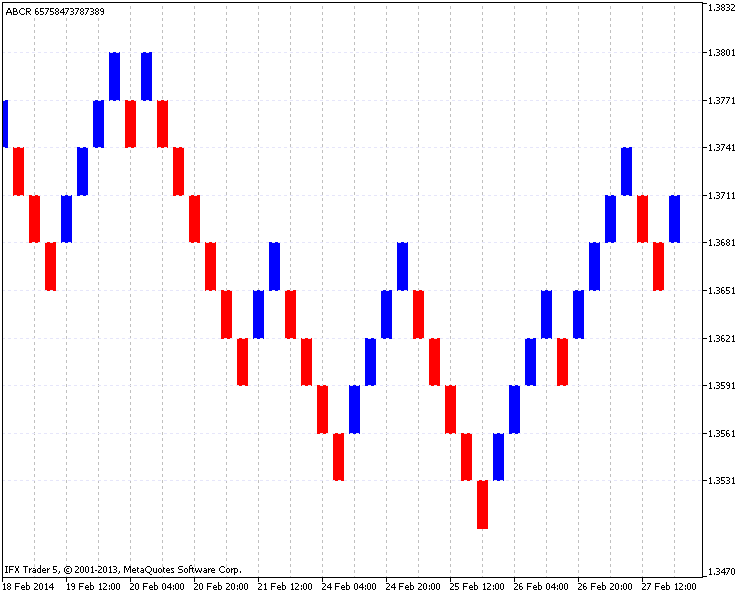
图例. 1. 一个标准 Renko 图表的例
一个 Renko 图表是在收盘价的基础上绘制。首先, 选择时间帧和箱体尺寸。
在本例中使用 EURUSD (H4 时间帧), 以及一个 30 点的箱体尺寸。此 Renko 制图的结果从 03.01.2014 至 31.01.2014 (一个月左右) 显示在图例. 2 中, 在左边, 是给定时间帧的图表 (此处您可以看到砖块的水平延伸线), 在右边, 是 Renko 图表的结果:

图例.2. 此为 Renko 绘图结果 EURUSD (H4, 箱体是 30 点)
让我们贴近观察图表原理。在图例. 2 中红色水平线根据价格的变化(30 点)显示每块砖的尺寸, 蓝色则指示感兴趣的实际日期。
如您图中所见,在 03.01.2014 结束时,一个蜡烛条的收盘价低于 1.3591,之前定义的价格范围 (红色水平线) 处于 1.3589 (标记价格), 因此在图表中创建一块向下的砖块。
之后价格横盘 (它并未收盘低于 1.3561 或高于 1.3651), 它开盘直到 20:00 10.01.2014 (蜡烛条创建在 16:00) 并收盘于 (高于 1.3651 标记价格) at 1.3663 (标记价格)。之后价格在 20:00 14.01.2014 (蜡烛条开盘于 16:00) 再次变为横盘, 此时它已经超越价格范围, 创建一块新砖并收盘于 1.3684。
然后您可以看到一个下探,价格四次突破图表的下降范围。在 12:00 23.01.2014 (蜡烛条开盘于 08:00) 此处一个向上突破两个价格范围, 反过来, 两块砖收盘于 1.3639。第一块砖清楚可见, 第二块砖则拉成一条长的垂直线 (由于和第一块砖并行开盘)。进一步构造则继续同样的原则。
当开发此指标时,所有函数均被尽可能的独立实现。其中一个主要的目的是最大限度地提高指标的潜能,更容易地进行市场分析。
计算并非在当前时间帧中进行, 即,时间帧是设置中被选择的, 并且不论指标在哪个时间帧启动, 它都显示设置的数据。它可以通过复制获取周期的数据至分离的缓存区数组来实现,之后进行计算,并填充指标输出缓冲器。
标准 Renko 图表构建于收盘价, 然而, 开盘价, 最高价, 最低价数值也用于改进分析。
由于在 Renko 图表中砖块的大小近似,比较有用的是了解更多动态的强烈价格行为驱动的市场点 (在少数砖块中)。出于这个目的,在砖块中有一个 (禁止的) 指示呈现一个小的垂直影线 (像 日本蜡烛条) , 表示选择时间帧柱线的最后一块砖的级别是升高或降低。
可以在主图之上构建 ZigZag,用来扩展图形分析。
图例. 3 展示指标的完整功能:

图例 3. 此指标用于 EURUSD 图表 (日线, 步长是 25 点)
指标代码相当庞大,它由 900 行构造。如前所述,函数的最大化分离,可能对理解算法变得复杂。一些来自以前文章的函数将作为基础。若在某些方面有误解,你可以参考 Kagi 制图建设指标 或者你可以给我发电子邮件。
每个函数的代码都将在文章中解释。所有函数均将顺便描述。
3.1. 指标输入参数
此 Renko 指标是不同颜色向上或向下砖块的范围。这个构造类型需要五个缓存区组合到一个 "彩色蜡烛条" 图形构造。剩下的四个缓冲区收集计算指标所需的数据。
取输入参数 (25), 分成组。
然后,代码声明缓冲区:五个主要的缓冲区用于图形绘制,其余四个用于保存设计和计算的数据。Price[] - 保存复制价格的缓存区,用来构建, Date[] - 保存复制数据的缓存区,用来在主图表上绘图, Price_high[] 和 Price_low[] - 保存最大最小数值的缓存区,用来在主图表上绘制 ZigZags。
在计算缓存区数组和辅助函数之后,声明变量: unc_draw_renko, func_draw_zig_zag, func_draw_renko_main_chart。它们将会在稍后解释。
//+------------------------------------------------------------------+
//|                                                         ABCR.mq5 |
//|                                   Azotskiy Aktiniy ICQ:695710750 |
//|                          https://www.mql5.com/ru/users/Aktiniy |
//+------------------------------------------------------------------+
//--- Auto Build Chart Renko
#property copyright "Azotskiy Aktiniy ICQ:695710750"
#property link      "https://www.mql5.com/ru/users/Aktiniy"
#property version   "1.00"
#property description "Auto Build Chart Renko"
#property description "   "
#property description "This indicator used to draw Renko chart in the indicator window, and in the main chart window"
#property indicator_separate_window
#property indicator_buffers 9
#property indicator_plots   1
//--- plot RENKO
#property indicator_label1  "RENKO"
#property indicator_type1   DRAW_COLOR_CANDLES
#property indicator_color1  clrRed,clrBlue,C'0,0,0',C'0,0,0',C'0,0,0',C'0,0,0',C'0,0,0',C'0,0,0'
#property indicator_style1  STYLE_SOLID
#property indicator_width1  1
//--- construction method
enum type_step_renko
  {
   point=0,   // Point
   percent=1, // Percent
  };
//--- type of price
enum type_price_renko
  {
   close=0, // Close
   open=1,  // Open
   high=2,  // High
   low=3,   // Low
  };
//--- input parameters
input double           step=10;                                 // Step
input type_step_renko  type_step=point;                         // Type of step
input long             magic_numb=65758473787389;               // Magic number
input int              levels_number=1000;                      // Number of levels (0-no levels)
input color            levels_color=clrLavender;                // Color of levels
input ENUM_TIMEFRAMES  time_frame=PERIOD_CURRENT;               // Calculation period
input ENUM_TIMEFRAMES  time_redraw=PERIOD_M1;                   // Chart redraw period
input datetime         first_date_start=D'2013.09.13 00:00:00'; // Start date
input type_price_renko type_price=close;                        // Price for construction
input bool             shadow_print=true;                       // Show shadows
input int              filter_number=0;                         // Bricks number needed to reversal
input bool             zig_zag=true;                            // Whether ZigZag should be drawn on the main chart
input bool             zig_zag_shadow=true;                     // Draw ZigZag at highs and lows of the price
input int              zig_zag_width=2;                         // ZigZag line width
input color            zig_zag_color_up=clrBlue;                // ZigZag up line color
input color            zig_zag_color_down=clrRed;               // ZigZag down line color
input bool             square_draw=true;                        // Whether bricks should be drawn on the main chart
input color            square_color_up=clrBlue;                 // Up brick color on the main chart
input color            square_color_down=clrRed;                // Down brick color on the main chart
input bool             square_fill=true;                        // Brick filling on the main chart
input int              square_width=2;                          // Brick line width on the main chart
input bool             frame_draw=true;                         // Whether to draw frames of the bricks
input int              frame_width=2;                           // Brick frame line width
input color            frame_color_up=clrBlue;                  // Up brick frames color
input color            frame_color_down=clrRed;                 // Down brick frames color
//--- indicator buffers
double         RENKO_open[];
double         RENKO_high[];
double         RENKO_low[];
double         RENKO_close[];
double         RENKO_color[];

double         Price[];      // copy price data to the buffer
double         Date[];       // copy data to the buffer
double         Price_high[]; // copy high prices to the buffer
double         Price_low[];  // copy low prices to the buffer
//--- calculation buffer arrays
double         up_price[];    // up brick price
double         down_price[];  // down brick price
char           type_box[];    // brick type (up, down)
datetime       time_box[];    // brick copy time
double         shadow_up[];   // up high price
double         shadow_down[]; // down low price
int            number_id[];   // Index of Price_high and Price_low arrays
//--- calculation global variables
int obj=0;           //variable for storing number of graphics objects
int a=0;             // variable to count bricks
int bars;            // number of bars
datetime date_stop;  // current data
datetime date_start; // start date variable, for calculations
bool date_change;    // variable for storing details about time changes
3.2. 指标初始化
指标缓存区与一维数组的绑定,寻址方式,如同时间序列,设置在 INDICATOR_DATA 和 INDICATOR_COLOR_INDEX 缓存区。其余动态数组的寻址 (Price[], Date[], Price_high[], Price_low[]) 没有变化, 因为它们仅用来保存数据。
其设置的数值也不会被显示在图表上。之后分配指标名称, 设置显示精度,禁止显示当前指标数值。
之后分配 date_start 变量数值 (开始计算日期)。这个分配给变量的数值,如果会加重指标负担,则不使用输入值。开始日期将被修正并通告。开始时间的分析函数或 "func_calc_date_start" 将对时间进行校正。
//+------------------------------------------------------------------+
//| Custom indicator initialization function                         |
//+------------------------------------------------------------------+
int OnInit()
  {
//--- indicator buffers mapping
   SetIndexBuffer(0,RENKO_open,INDICATOR_DATA);
   ArraySetAsSeries(RENKO_open,true);
   SetIndexBuffer(1,RENKO_high,INDICATOR_DATA);
   ArraySetAsSeries(RENKO_high,true);
   SetIndexBuffer(2,RENKO_low,INDICATOR_DATA);
   ArraySetAsSeries(RENKO_low,true);
   SetIndexBuffer(3,RENKO_close,INDICATOR_DATA);
   ArraySetAsSeries(RENKO_close,true);
   SetIndexBuffer(4,RENKO_color,INDICATOR_COLOR_INDEX);
   ArraySetAsSeries(RENKO_color,true);
//---
   SetIndexBuffer(5,Price,INDICATOR_CALCULATIONS);      // initialize price buffer
   SetIndexBuffer(6,Date,INDICATOR_CALCULATIONS);       // initialize data buffer
   SetIndexBuffer(7,Price_high,INDICATOR_CALCULATIONS); // initialize high price
   SetIndexBuffer(8,Price_low,INDICATOR_CALCULATIONS);  // initialize low price
//--- set data which will not be drawn
   PlotIndexSetDouble(0,PLOT_EMPTY_VALUE,0);
//--- set the indicator appearance
   IndicatorSetString(INDICATOR_SHORTNAME,"ABCR "+IntegerToString(magic_numb)); // indicator name
//--- display accuracy
   IndicatorSetInteger(INDICATOR_DIGITS,_Digits);
//--- prohibit display of the results of the indicator current values
   PlotIndexSetInteger(0,PLOT_SHOW_DATA,false);
//--- assign start date variable value
   date_start=first_date_start;
//---
   return(INIT_SUCCEEDED);
  }
3.3. 分析计算开始日期的函数
此函数很小并且主要由循环组成。这里只有两个输入参数 - 初始设置开始日期,以及计算结束日期 (当前日期)。开始日期将被函数改变,并显示答案。
函数体从测量接收缓存区数组开始 (所有缓存区有相同尺寸,等于选定时间帧的柱线数量)。之后测量出被选择的时间帧的柱线数量。
在循环条件中比较被选择的时间帧的柱线数量和缓存区数组尺寸。如果您有较多的柱线,即,它们不能全部被放进缓存区数组, 则获取的时间缩短十天,意思是说分析开始日期加入十天。继续此步,直到缓存区数组不能包括所有柱线数据。函数返回计算日期。
//+------------------------------------------------------------------+
//| Func Calculate Date Start                                        |
//+------------------------------------------------------------------+
datetime func_calc_date_start(datetime input_data_start,// initially start date set
                              datetime data_stop)       // calculation end date (current date)
//---
  {
   int Array_Size=ArraySize(Price);
   int Bars_Size=Bars(_Symbol,time_frame,input_data_start,data_stop);
   for(;Bars_Size>Array_Size;input_data_start+=864000) // 864000 = 10 days
     {
      Bars_Size=Bars(_Symbol,time_frame,input_data_start,data_stop);
     }
   return(input_data_start);
//---
  }
3.4. 数据复制函数
首先, 数据的复制经过复制函数 (func_copy_price 和 func_copy_date)。
让我们来研究复制函数价格或func_copy_price,它可以让您在数组中复制规定时间帧,规定周期的开盘价,收盘价,最高价和最低价。在成功复制后,函数返回 "true"。
函数开始初始化为 false 值, 之后一个复制数据的变量被初始化为负值。一个通用数组 price_interim[] 保存临时复制数据,并且声明 bars_to_copy 变量来保护复制数据。
此外,函数重置早前声明的变量来保存复制数据,计算时间帧的柱线数量,并且根据选择价格(0-收盘价,1-开盘价,2-最高价,3-最低价),以及一个 switch 语句,分配之前复制数据的 bars_copied 变量的值。之后计算复制的数据数量。如果数据以前复制过, 则最后的复制柱线信息被删除以保护图表上的变化。
根据开关复制所需价格数据至 price_interim[] 时间数组。再之后,检查复制结果并根据开关填充复制数据变量。
//+------------------------------------------------------------------+
//| Func Copy Price                                                  |
//+------------------------------------------------------------------+
bool func_copy_price(double &result_array[],
                     ENUM_TIMEFRAMES period,// Timeframe
                     datetime data_start,
                     datetime data_stop,
                     char price_type) // 0-Close, 1-Open, 2-High, 3-Low
  {
//---
   int x=false;        // Variable for answering
   int result_copy=-1; // copied data number
//---
   static double price_interim[]; // Temporal dynamic array for storing copied data
   static int bars_to_copy;       // number of bars to copy
   static int bars_copied_0;      // number of copied bars from Close start date
   static int bars_copied_1;      // number of copied bars from Open start date
   static int bars_copied_2;      // number of copied bars from High start date
   static int bars_copied_3;      // number of copied bars from Low start date
   static int bars_copied;        // number of copied bars from the common variable start date
//--- variables reset due to changes in a start date
   if(date_change==true)
     {
      ZeroMemory(price_interim);
      ZeroMemory(bars_to_copy);
      ZeroMemory(bars_copied_0);
      ZeroMemory(bars_copied_1);
      ZeroMemory(bars_copied_2);
      ZeroMemory(bars_copied_3);
      ZeroMemory(bars_copied);
     }
//--- get an information about the current bars number on the timeframe
   bars_to_copy=Bars(_Symbol,period,data_start,data_stop);
//--- assign a copied function value to a common variable
   switch(price_type)
     {
      case 0:
         //--- Close
         bars_copied=bars_copied_0;
         break;
      case 1:
         //--- Open
         bars_copied=bars_copied_1;
         break;
      case 2:
         //--- High
         bars_copied=bars_copied_2;
         break;
      case 3:
         //--- Low
         bars_copied=bars_copied_3;
         break;
     }
//--- calculate number of bars required to be copied
   bars_to_copy-=bars_copied;
//--- if it is not the first time the data has been copied
   if(bars_copied!=0)
     {
      bars_copied--;
      bars_to_copy++;
     }
//--- change the size of the recieving array
   ArrayResize(price_interim,bars_to_copy);
//--- copy data to the recieving array
   switch(price_type)
     {
      case 0:
         //--- Close
        {
         result_copy=CopyClose(_Symbol,period,0,bars_to_copy,price_interim);
        }
      break;
      case 1:
         //--- Open
        {
         result_copy=CopyOpen(_Symbol,period,0,bars_to_copy,price_interim);
        }
      break;
      case 2:
         //--- High
        {
         result_copy=CopyHigh(_Symbol,period,0,bars_to_copy,price_interim);
        }
      break;
      case 3:
         //--- Low
        {
         result_copy=CopyLow(_Symbol,period,0,bars_to_copy,price_interim);
        }
      break;
     }
//--- check the result of data copying
   if(result_copy!=-1) // if copying to the intermediate array is successful
     {
      ArrayCopy(result_array,price_interim,bars_copied,0,WHOLE_ARRAY); // copy the data from the temporary array to the main one
      x=true;                   // assign the positive answer to the function
      bars_copied+=result_copy; // increase the value of the processed data
     }
//--- return the information about the processed data with one of the copied variables
   switch(price_type)
     {
      case 0:
         //--- Close
         bars_copied_0=bars_copied;
         break;
      case 1:
         //--- Open
         bars_copied_1=bars_copied;
         break;
      case 2:
         //--- High
         bars_copied_2=bars_copied;
         break;
      case 3:
         //--- Low
         bars_copied_3=bars_copied;
         break;
     }
//---
   return(x);
  }
"func_copy_date" 或日期复制函数。函数代码与上述提及的单元类似, 不同之处仅在于复制数据的类型。
//+------------------------------------------------------------------+
//| Func Copy Date                                                   |
//+------------------------------------------------------------------+
bool func_copy_date(double &result_array[],
                    ENUM_TIMEFRAMES period,// timeframe
                    datetime data_start,
                    datetime data_stop)
  {
//---
   int x=false;                    // variable for answer
   int result_copy=-1;             // number of copied data
   static datetime time_interim[]; // temporaty dynamic array for storing the copied data
   static int bars_to_copy;        // bars number required to be copied
   static int bars_copied;         // copied bars with start date
//--- variables reset due to the start date change
   if(date_change==true)
     {
      ZeroMemory(time_interim);
      ZeroMemory(bars_to_copy);
      ZeroMemory(bars_copied);
     }
//---
   bars_to_copy=Bars(_Symbol,period,data_start,data_stop); // Find out the current number of bars on the time interval
   bars_to_copy-=bars_copied; // Calculate the number of bars to be copied
//---
   if(bars_copied!=0) // If it is not the first time the data has been copied
     {
      bars_copied--;
      bars_to_copy++;
     }
//---
   ArrayResize(time_interim,bars_to_copy); // Change the size of the receiving array
   result_copy=CopyTime(_Symbol,period,0,bars_to_copy,time_interim);
//---
   if(result_copy!=-1) // If copying to the intermediate array is successful
     {
      ArrayCopy(result_array,time_interim,bars_copied,0,WHOLE_ARRAY); // Copy the data from the temporary array to the main one
      x=true; // assign the positive answer to the function
      bars_copied+=result_copy; // Increase the value of the processed data
     }
//---
   return(x);
  }
3.5. 砖块计算
正如您在指标参数中所见, 一块砖的尺寸可以设为点数或当前价格百分比两者之一。点数是固定植,但如何用百分比计算?为了这个目的,有了这个 "func_calc_dorstep" 砖块计算函数。
这里有三个输入参数: 当前价格 (用于计算价格百分比, 若砖块尺寸为百分比), 计算方法 (点数或百分比), 以及步长尺寸 (设置的数值可以是百分比或点数)。
在函数开始,变量 answer 初始化为双精度类型,并根据条件选择的计算方法分配点数。之后 answer 变量转换为整数类型,并只保留整数部分。
//+------------------------------------------------------------------+
//| Func Calculate Doorstep                                          |
//+------------------------------------------------------------------+
int func_calc_dorstep(double price,      // price
                      char type_doorstep,// step type
                      double doorstep)   // step
  {
   double x=0;          // variable for answer

   if(type_doorstep==0) // If the calculation is to be performed in points
     {
      x=doorstep;
     }

   if(type_doorstep==1) // If the calculation is to be performed in percentage
     {
      x=price/_Point*doorstep/100;
     }

   return((int)x);
  }
3.6. 主函数 - Renko 图表
Renko 图表主函数 - "func_draw_renko"。此函数负责图形缓存区 (指标缓存区) 以及计算填充缓存区数组。计算缓存区保存每块砖的信息。
函数的输入参数是价格数据数组和柱线构造日期。这里您可以发现有关步长及它的参数的信息, 反转滤波器和阴影绘制的参数。
此函数可以分隔为两部分: 一部分计算砖块数量,另一部分计算图形缓存区填充。
开始时,函数缓存区被置为开关关闭的空箱。稍后辅助变量进入: "doorstep_now" 变量用于步长 (用来改变百分比步长的尺寸), "point_go" 保存自上次建立的砖块的距离信息, "a" 变量用于砖块计算, "up_price_calc" 和 "down_price_calc" - 最后分析的最高和最低价, "type_box_calc" - 最后分析的砖块类型 (上或下)。
函数的两部分都由循环组成, 第二部分完成第一部分。分析过程详情。
第一循环处理所有复制数值, "bars" 值负责复制数据数量 (它在 "func_concolidation" 函数中计算, 稍后研究)。此外,在函数循环开始计算砖块尺寸。由于每根柱线都有不同的收盘价,如果使用百分比步长,每根柱线应分别计算。
有条件的 if 语句检查价格方向,而价格却要通过一个或多个步距。在价格移动方向确定后,检查以前的运动 (最后一块砖) 的条件。这样做是因为指标参数包括过滤器参数 (需要反转的砖块数量)。所有条件检查后循环开始, 它作为砖块被处理多次, 来表现当前价格走势。
显示的柱线被计算, 计算缓存区数组尺寸改变, 且它们被重置。这之后, 前几个 (在第一次比较中使用) 计算数组被分配一次值。
如果最大可能的显示柱线少于可能的砖块数量, 额外砖块被计算, 并显示最低值的消息。这样做是为了防止图表的显示错误。
砖块数量变量在主循环开始时重置。不像以前的循环,主循环也负责填充计算缓存区数组,且砖块计数器重置。
在函数结尾图形缓存区被填充。
//+------------------------------------------------------------------+
//| Func Draw Renko                                                  |
//+------------------------------------------------------------------+
void func_draw_renko(double &price[],   // prices array
                     double &date[],    // date array
                     int number_filter, // bricks number for reversal
                     bool draw_shadow,  // draw shadow
                     char type_doorstep,// step type
                     double doorstep)   // step
  {
//--- arrays reset
//--- drawing buffer arrays
   ZeroMemory(RENKO_close);
   ZeroMemory(RENKO_color);
   ZeroMemory(RENKO_high);
   ZeroMemory(RENKO_low);
   ZeroMemory(RENKO_open);
//--- additional variables
   int doorstep_now; // current step
   int point_go;     // passed points
//--- additional variables for bricks number calculating
   a=0;
   double up_price_calc=price[0];
   double down_price_calc=price[0];
   char type_box_calc=0;

   for(int z=0; z<bars; z++) //---> bricks calculating loop
     {
      //--- calculate step according to the current price
      doorstep_now=func_calc_dorstep(price[z],type_doorstep,doorstep);
      //--- if price rises
      if((price[z]-up_price_calc)/_Point>=doorstep_now)
        {
         //--- calculate points passed
         point_go=int((price[z]-up_price_calc)/_Point);
         //--- prices was rising or unknown price behavour
         if(type_box_calc==1 || type_box_calc==0)
           {
            for(int y=point_go; y>=doorstep_now; y-=doorstep_now)
              {
               //--- add the next brick
               a++;
               //--- add value of the next brick low price
               down_price_calc=up_price_calc;
               //--- add value of the next brick up price
               up_price_calc=down_price_calc+(doorstep_now*_Point);
               //--- set the brick type (up)
               type_box_calc=1;
              }
           }
         //--- price went down
         if(type_box_calc==-1)
           {
            if((point_go/doorstep_now)>=number_filter)
              {
               for(int y=point_go; y>=doorstep_now; y-=doorstep_now)
                 {
                  //--- add the next brick
                  a++;
                  //--- set the next brick down price
                  down_price_calc=up_price_calc;
                  //--- set the next brick up price
                  up_price_calc=down_price_calc+(doorstep_now*_Point);
                  //--- set the brick type (up)
                  type_box_calc=1;
                 }
              }
           }
        }
      //--- if the price moves downwards
      if((down_price_calc-price[z])/_Point>=doorstep_now)
        {
         //--- calculate the points passed
         point_go=int((down_price_calc-price[z])/_Point);
         //--- if the price went downwards or the direction is unknown
         if(type_box_calc==-1 || type_box_calc==0)
           {
            for(int y=point_go; y>=doorstep_now; y-=doorstep_now)
              {
               //--- add the next brick
               a++;
               //--- set the next brick low price value
               up_price_calc=down_price_calc;
               //--- set the next brick up price value
               down_price_calc=up_price_calc-(doorstep_now*_Point);
               //--- set the britck type (up)
               type_box_calc=-1;
              }
           }
         //--- the price moved upwards
         if(type_box_calc==1)
           {
            if((point_go/doorstep_now)>=number_filter)
              {
               for(int y=point_go; y>=doorstep_now; y-=doorstep_now)
                 {
                  //--- add the next brick
                  a++;
                  //--- set the next brick down price value
                  up_price_calc=down_price_calc;
                  //--- set the next brick up price value
                  down_price_calc=up_price_calc-(doorstep_now*_Point);
                  //--- set the brick type (up)
                  type_box_calc=-1;
                 }
              }
           }
        }
     } //---< bricks calculate loop
//--- calculate the number of display bars
   int b=Bars(_Symbol,PERIOD_CURRENT);
//--- resize arrays
   ArrayResize(up_price,b);
   ArrayResize(down_price,b);
   ArrayResize(type_box,b);
   ArrayResize(time_box,b);
   ArrayResize(shadow_up,b);
   ArrayResize(shadow_down,b);
   ArrayResize(number_id,b);
//--- resize calculation buffers array
   ZeroMemory(up_price);
   ZeroMemory(down_price);
   ZeroMemory(type_box);
   ZeroMemory(time_box);
   ZeroMemory(shadow_up);
   ZeroMemory(shadow_down);
   ZeroMemory(number_id);
//--- fill arrays with the initial values
   up_price[0]=price[0];
   down_price[0]=price[0];
   type_box[0]=0;
//--- calculate odd bricks number
   int l=a-b;
   int turn_cycle=l/(b-1);
   int turn_rest=(int)MathMod(l,(b-1))+2;
   int turn_var=0;
//--- message of partially displayed bricks
   if(a>b)Alert("More bricks than can be placed on the chart, the step is small");

   a=0; //--- reset bricks claculating variable
   for(int z=0; z<bars; z++) //---> Main loop
     {
      //--- calculate the step according to the price
      doorstep_now=func_calc_dorstep(price[z],type_doorstep,doorstep);
      //---if the price moves upwards
      if((price[z]-up_price[a])/_Point>=doorstep_now)
        {
         //--- calculate the points passed
 point_go=int((price[z]-up_price[a])/_Point);
         //--- price moved upwards or its behavour is unknown
         if(type_box[a]==1 || type_box[a]==0)
           {
            for(int y=point_go; y>=doorstep_now; y-=doorstep_now)
              {
               a++; //--- add the next brick
               if((a==b && turn_var<turn_cycle) || (turn_var==turn_cycle && turn_rest==a))
                 {
                  up_price[0]=up_price[a-1];
                  a=1;        // bricks calculator reset
                  turn_var++; // calculator of loops reset
                 }
               //--- the next brick low price value
               down_price[a]=up_price[a-1];
               //--- set the brick up price
               up_price[a]=down_price[a]+(doorstep_now*_Point);

               //--- set the up shadow value
               if(shadow_print==true) shadow_up[a]=price[z]; //to the upper price level
               else shadow_up[a]=up_price[a];                // to the up price level

               //--- set the low price value(to the brick price level)
               shadow_down[a]=down_price[a];
               //--- value of the brick closing time
               time_box[a]=(datetime)Date[z];
               //--- set the brick type (up)
               type_box[a]=1;
               //--- set the index
               number_id[a]=z;
              }
           }
         //--- the price moved downwards
         if(type_box[a]==-1)
           {
            if((point_go/doorstep_now)>=number_filter)
              {
               for(int y=point_go; y>=doorstep_now; y-=doorstep_now)
                 {
                  a++; //--- add the next brick

                  if((a==b && turn_var<turn_cycle) || (turn_var==turn_cycle && turn_rest==a))
                    {
                     up_price[0]=up_price[a-1];
                     a=1;        // bricks counter reset
                     turn_var++; // loops reset cycle
                    }
                  //--- set the next brick low price value
                  down_price[a]=up_price[a-1];
                  //--- set the next brick up price
                  up_price[a]=down_price[a]+(doorstep_now*_Point);

                  //--- set the up shadow value
                  if(shadow_print==true) shadow_up[a]=price[z]; // at the up price level
                  else shadow_up[a]=up_price[a];                // the brick up price level

                  //--- set of the down price value (the brick price level)
                  shadow_down[a]=down_price[a];
                  //--- set the close time
                  time_box[a]=(datetime)Date[z];
                  //--- set the up brick
                  type_box[a]=1;
                  //--- set index
                  number_id[a]=z;
                 }
              }
           }
        }

      //--- if price moves upwards
      if((down_price[a]-price[z])/_Point>=doorstep_now)
        {
         //--- calculate the points passed
         point_go=int((down_price[a]-price[z])/_Point);
         //--- price moved downwards or the direction is unknown
         if(type_box[a]==-1 || type_box[a]==0)
           {
            for(int y=point_go; y>=doorstep_now; y-=doorstep_now)
              {
               a++; //--- add the next brick
               if((a==b && turn_var<turn_cycle) || (turn_var==turn_cycle && turn_rest==a))
                 {
                  down_price[0]=down_price[a-1];
                  a=1;        // set the bricks counter to zero
                  turn_var++; // reset loop counter
                 }
               //--- set the next brick down price
               up_price[a]=down_price[a-1];
               //--- set the next brick up price
               down_price[a]=up_price[a]-(doorstep_now*_Point);

               //--- set the down shadow value
               if(shadow_print==true) shadow_down[a]=price[z]; //--- the last lowest price level
               else shadow_down[a]=down_price[a];              //--- low price level

               //--- set the up price value
               shadow_up[a]=up_price[a];
               //--- set the brick close time
               time_box[a]=set the down shadow value];
               //--- set the brick type (down)
               type_box[a]=-1;
               //--- set index
               number_id[a]=z;
              }
           }
         //--- price moved upwards
         if(type_box[a]==1)
           {
            if((point_go/doorstep_now)>=number_filter)
              {
               for(int y=point_go; y>=doorstep_now; y-=doorstep_now)
                 {
                  a++; //--- add the next brick
                  if((a==b && turn_var<turn_cycle) || (turn_var==turn_cycle && turn_rest==a))
                    {
                     down_price[0]=down_price[a-1];
                     a=1;        // reset bricks counter
                     turn_var++; // reset loop counter
                    }

                  up_price[a]=down_price[a-1]; //--- set the next brick down price
                  down_price[a]=up_price[a]-(doorstep_now*_Point); //--- set the up price value

                  //--- set the down shadow value
                  if(shadow_print==true) shadow_down[a]=price[z]; // at the lowest price level
                  else shadow_down[a]=down_price[a];              // at the down price level

                  //--- set the up price level
                  shadow_up[a]=up_price[a];
                  //--- set the brick close time
                  time_box[a]=(datetime)Date[z];
                  //--- set the brick type (down)
                  type_box[a]=-1;
                  //--- index set
                  number_id[a]=z;
                 }
              }
           }
        }
     } //---< Main loop

//--- fill the draw buffer
   int y=a;
   for(int z=0; z<a; z++)
     {
      if(type_box[y]==1)RENKO_color[z]=0;
      else RENKO_color[z]=1;
      RENKO_open[z]=down_price[y];
      RENKO_close[z]=up_price[y];
      RENKO_high[z]=shadow_up[y];
      RENKO_low[z]=shadow_down[y];
      y--;
     }
  }
3.7. 创建 "趋势线" 和 "长方形" 图形对象的函数
创建 "趋势线" 图形对象函数 "func_create_trend_line" 和创建 "长方形" 图形对象函数 "func_create_square_or_rectangle" 基于参考 OBJ_RECTANGLE 和 OBJ_TREND 的所述数据。它们用于在 "Renko" 图表中创建图形对象,并在主图上建构 "ZigZag"。
//+------------------------------------------------------------------+
//| Func Create Trend Line                                           |
//+------------------------------------------------------------------+
void func_create_trend_line(string name,
                            double price1,
                            double price2,
                            datetime time1,
                            datetime time2,
                            int width,
                            color color_line)
  {
   ObjectCreate(0,name,OBJ_TREND,0,time1,price1,time2,price2);
//--- set the line color
   ObjectSetInteger(0,name,OBJPROP_COLOR,color_line);
//--- set the line display style
   ObjectSetInteger(0,name,OBJPROP_STYLE,STYLE_SOLID);
//--- set the width of the line
   ObjectSetInteger(0,name,OBJPROP_WIDTH,width);
//--- display in the foreground (false) or in the (true) background
   ObjectSetInteger(0,name,OBJPROP_BACK,false);
//--- enable (true) or disable (false) the mode of the left line display
   ObjectSetInteger(0,name,OBJPROP_RAY_LEFT,false);
//--- enable (true) or disable (false) the right line display
   ObjectSetInteger(0,name,OBJPROP_RAY_RIGHT,false);
  }
//+------------------------------------------------------------------+
//| Func Create Square or Rectangle                                  |
//+------------------------------------------------------------------+
void func_create_square_or_rectangle(string name,
                                     double price1,
                                     double price2,
                                     datetime time1,
                                     datetime time2,
                                     int width,
                                     color color_square,
                                     bool fill)
  {
//--- create rectangle according to the setpoints
   ObjectCreate(0,name,OBJ_RECTANGLE,0,time1,price1,time2,price2);
//--- set the rectangle color
   ObjectSetInteger(0,name,OBJPROP_COLOR,color_square);
//--- set style of rectangle color
   ObjectSetInteger(0,name,OBJPROP_STYLE,STYLE_SOLID);
//--- set lines width
   ObjectSetInteger(0,name,OBJPROP_WIDTH,width);
//--- activate (true) or disactivate (false) mode of rectangle colouring
   ObjectSetInteger(0,name,OBJPROP_FILL,fill);
//--- display in the foreground (false) or in the background (true)
   ObjectSetInteger(0,name,OBJPROP_BACK,false);
  }
3.8. 在主图表上构造 "Renko"
由于使用了通用的计算缓冲器数组,Renko 绘图函数 "func_draw_renko_main_chart" 相当紧凑。
输入参数包括: 带边框的上行或下行砖块, 两类边框宽度 (第一个用于砖块, 第二个 - 用于它的边框), 三个显示选项 ( "砖块", 它们的颜色和边框)。
首先, 声明对象名称变量, 之后循环按照名称生成每个对象, 并根据之前砖块类型, "趋势线" 和 "长方形" 图形对象函数启动。参数取自计算缓存区数组。
//+------------------------------------------------------------------+
//| Func Draw Renko Main Chart                                       |
//+------------------------------------------------------------------+
void func_draw_renko_main_chart(color color_square_up,
                                color color_square_down,
                                color color_frame_up,
                                color color_frame_down,
                                int width_square,
                                int width_frame,
                                bool square,
                                bool fill,
                                bool frame)
  {
   string name_square;
   string name_frame;

   for(int z=2; z<=a; z++)
     {
      name_square=IntegerToString(magic_numb)+"_Square_"+IntegerToString(z);
      name_frame=IntegerToString(magic_numb)+"_Frame_"+IntegerToString(z);
      if(type_box[z]==1)
        {
         if(square==true)func_create_square_or_rectangle(name_square,up_price[z],down_price[z],time_box[z-1],time_box[z],width_square,color_square_up,fill);
         if(frame==true)func_create_square_or_rectangle(name_frame,up_price[z],down_price[z],time_box[z-1],time_box[z],width_frame,color_frame_up,false);
        }
      if(type_box[z]==-1)
        {
         if(square==true)func_create_square_or_rectangle(name_square,up_price[z],down_price[z],time_box[z-1],time_box[z],width_square,color_square_down,fill);
         if(frame==true)func_create_square_or_rectangle(name_frame,up_price[z],down_price[z],time_box[z-1],time_box[z],width_frame,color_frame_down,false);
        }
     }
  }
3.9. 主图上的 "ZigZag" 构造
接下来的一种补充指标是 "ZigZag" 制图函数 "func_draw_zig_zag"。
输入参数: 绘制方式 (最大或最小价格, 或图表上的点数), 线宽, 向上或向下的线颜色。
这个 "zig_zag_shadow" 参数改变可以在图 4 看到。如果 "true" 开关开, 指标在阴影点上绘制 "ZigZag" 线 (最大和最小价格), 在 "false" 选项, 则 "ZigZag" 线绘制在 "Renko" 最大和最小点上。
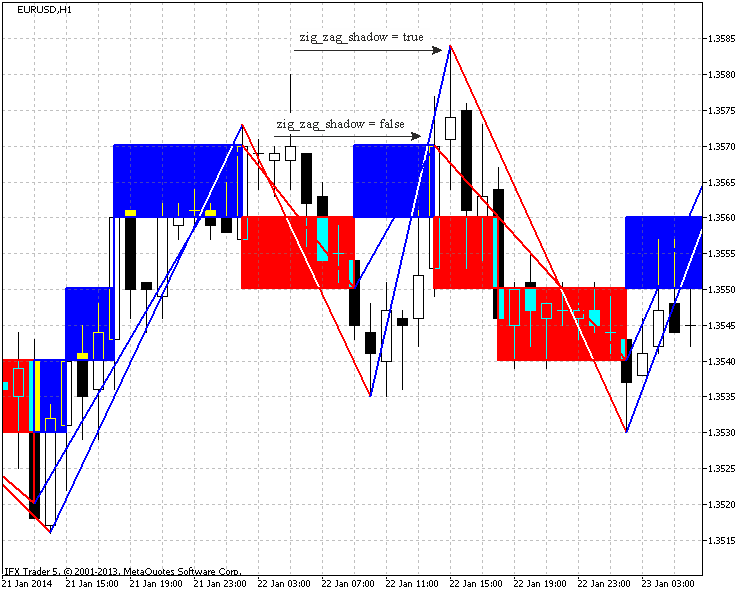
图例.4. 参数对 "zig_zag_shadow" 的影响 EURUSD, H1, 10 点。
为了构建 "趋势线" 对象,需要两点 (开始和结束),两个变量作为价格参数,以及两个变量作为日期参数。依据初始砖块类型,If 条件语句设置第一个点。
循环构造所有对象。如您所见,分析循环从第二块砖开始启动,因为第一个点已经设置。之后 if 条件语句检查砖块类型 (价格行为)。对象名称变量被填充,依据移动变化,循环分裂。反过来,依据绘制方法,它被分割为两个变量。
如果它显示最大最小价格, Price_high[] 和 Price_low[] 数据数组搜索较近的最大和最小点。搜索受到最近柱线的限制。
如果它依据图表点数,数据从缓存区数组分配。
"趋势线" 构造函数被调用。函数结束分析并绘制 "ZigZag"。
//+------------------------------------------------------------------+
//| Func Draw Zig Zag                                                |
//+------------------------------------------------------------------+
void func_draw_zig_zag(bool price_shadow,
                       int line_width,
                       color line_color_up,
                       color line_color_down)
  {
   double price_1=0;
   double price_2=0;
   datetime date_1=0;
   datetime date_2=0;

   if(type_box[1]==1)price_1=down_price[1];
   if(type_box[1]==-1)price_1=up_price[1];
   date_1=time_box[1];
   int id=0; //  Low & High array storing variable
   int n=0;  // variable for name forming

   string name_line; //--- variable responsible for the "trend line" name

   for(int z=2; z<=a; z++)
     {
      if(type_box[z]!=type_box[z-1])
        {
         n++;
         name_line=IntegerToString(magic_numb)+"_Line_"+IntegerToString(n);
         if(type_box[z]==1)
           {
            if(price_shadow==true)
              {
               id=number_id[z-1];
               if((id-1)>0 && Price_low[id-1]<Price_low[id])id--;
               if(Price_low[id+1]<Price_low[id])id++;
               price_2=Price_low[id];
               date_2=(datetime)Date[id];
              }
            else
              {
               price_2=down_price[z-1];
               date_2=time_box[z-1];
              }
            func_create_trend_line(name_line,price_1,price_2,date_1,date_2,line_width,line_color_down);
            price_1=price_2;
            date_1=date_2;
           }
         if(type_box[z]==-1)
           {
            if(price_shadow==true)
              {
               id=number_id[z-1];
               if((id-1)>0 && Price_high[id-1]>Price_high[id])id--;
               if(Price_high[id+1]>Price_high[id])id++;
               price_2=Price_high[id];
               date_2=(datetime)Date[id];
              }
            else
              {
               price_2=up_price[z-1];
               date_2=time_box[z-1];
              }
            func_create_trend_line(name_line,price_1,price_2,date_1,date_2,line_width,line_color_up);
            price_1=price_2;
            date_1=date_2;
           }
        }
     }
  }
3.10. 删除之前创建的图形对象
魔幻数用于确定指标对象。它简化了在同一图表上启动若干指标并删除对象的过程。
下一个函数是删除对象 "func_delete_objects"。名称 (依赖对象设置: 趋势线或长方形) 和对象数量是两个输入参数。函数选择已分配名称的对象并且删除对象。
//+------------------------------------------------------------------+
//| Func Delete Objects                                              |
//+------------------------------------------------------------------+
void func_delete_objects(string name,
                         int number)
  {
   string name_del;
   for(int x=0; x<=number; x++)
     {
      name_del=name+IntegerToString(x);
      ObjectDelete(0,name_del);
     }
  }
函数整合所有功能,来删除所有指标创建的对象。
//+------------------------------------------------------------------+
//| Func All Delete                                                  |
//+------------------------------------------------------------------+
void func_all_delete()
  {
//--- the graphical objects calculating
   obj=ObjectsTotal(0,-1,-1);
//--- all indicator graphical objects deleting
   func_delete_objects(IntegerToString(magic_numb)+"_Line_",obj);
   func_delete_objects(IntegerToString(magic_numb)+"_Square_",obj);
   func_delete_objects(IntegerToString(magic_numb)+"_Frame_",obj);
//--- the chart redrawing
   ChartRedraw(0);
  }
3.11. 创建级别函数
此 "func_create_levels" 函数创建级别,在指标窗口中简化图表显示。它仅有两个输入参数: 创建级别数量和它们的颜色。
在函数体中 IndicatorSetInteger 用来设置显示级别的数量, 之后是每个级别的价格和颜色。
//+------------------------------------------------------------------+
//| Func Create Levels                                               |
//+------------------------------------------------------------------+
void func_create_levels(int level_number,
                        color level_color)
  {
//--- set the number of levels in the indicator window
   IndicatorSetInteger(INDICATOR_LEVELS,level_number);
 which brick is taken to draw levels
   int k=0;
   if(a>level_number)k=a-level_number;
//--- set levels prices
   for(int z=0;(z<=level_number && k<=a); z++,k++)
     {
      IndicatorSetDouble(INDICATOR_LEVELVALUE,z,up_price[k]);
      IndicatorSetInteger(INDICATOR_LEVELCOLOR,z,level_color);
     }
  }
3.12. 整合函数
此 "func_consolidation" 函数用来创建所有函数的整合。
函数调用所有可执行的函数。
//+------------------------------------------------------------------+
//| Func Consolidation                                               |
//+------------------------------------------------------------------+
void func_concolidation()
  {
//--- deleting all the graphical objects of the indicator
   func_all_delete();
//--- the current date
   date_stop=TimeCurrent();
//--- the initial date changing due to the restricted buffer size
   if((bars=Bars(_Symbol,time_frame,date_start,date_stop))>ArraySize(Price))
     {
      date_start=func_calc_date_start(date_start,date_stop);
      Alert("The initial date was changed due to the lack of the chart size");
      date_change=true;
      //--- calculation of bars on the taken timeframe
      bars=Bars(_Symbol,time_frame,date_start,date_stop);
     }
//---
   bool result_copy_price=func_copy_price(Price,time_frame,date_start,date_stop,type_price);
   bool result_copy_date=func_copy_date(Date,time_frame,date_start,date_stop);
//--- change the date parameter
   if(result_copy_price=true && result_copy_date==true)date_change=false;
//---
   if(zig_zag_shadow==true)
     {
      func_copy_price(Price_high,time_frame,date_start,date_stop,2);
      func_copy_price(Price_low,time_frame,date_start,date_stop,3);
     }
//---
   func_draw_renko(Price,Date,filter_number,shadow_print,type_step,step);
   if(zig_zag==true)func_draw_zig_zag(zig_zag_shadow,zig_zag_width,zig_zag_color_up,zig_zag_color_down);
//---
   func_draw_renko_main_chart(square_color_up,square_color_down,frame_color_up,frame_color_down,square_width,frame_width,square_draw,square_fill,frame_draw);
   func_create_levels(levels_number,levels_color);
//--- redraw the chart
   ChartRedraw(0);
  }
3.13. OnCalculate() 和 OnChartEvent() 函数
在处理 OnCalculate() 函数之前, 让我们先来看看 "func_new_bar" 函数,它用来分析新的柱线。
它的简化函数描述在 IsNewBar。
//+------------------------------------------------------------------+
//| Func New Bar                                                     |
//+------------------------------------------------------------------+
bool func_new_bar(ENUM_TIMEFRAMES period_time)
  {
//---
   static datetime old_times; // array for storing old values
   bool res=false;            // analysis result variable
   datetime new_time[1];      // new bar time
//---
   int copied=CopyTime(_Symbol,period_time,0,1,new_time); // copy the time of the new bar into the new_time box
//---
   if(copied>0) // все ок. data have been copied
     {
      if(old_times!=new_time[0])    // if the bar's old time is not equal to new one
        {
         if(old_times!=0) res=true; // if it is not the first launch, true = new bar
         old_times=new_time[0];     // store the bar's time
        }
     }
//---
   return(res);
  }
当图表更新时,有一根新柱线被创建,此 OnCalculate() 函数开始整合所有函数。
//+------------------------------------------------------------------+
//| Custom indicator iteration function                              |
//+------------------------------------------------------------------+
int OnCalculate(const int rates_total,
                const int prev_calculated,
                const int begin,
                const double &price[])
  {
//---
   if(func_new_bar(time_redraw)==true)
     {
      func_concolidation();
     }
//--- return value of prev_calculated for next call
   return(rates_total);
  }
此 OnChartEvent() 函数,通过按下 "C" 删除所有图形对象,按下 "R" 启动图表重画 (整合函数)。
//+------------------------------------------------------------------+
//| OnChartEvent                                                     |
//+------------------------------------------------------------------+
void OnChartEvent(const int id,         // event ID
                  const long& lparam,   // long type event parameter
                  const double& dparam, // double type event parameter
                  const string& sparam) // string type event parameter
  {
//--- Keyboard button pressing event
   if(id==CHARTEVENT_KEYDOWN)
     {
      if(lparam==82) //--- "R" key has been pressed
        {
         //--- call of the consolidation function
         func_concolidation();
        }
      if(lparam==67) //--- "C" key has been pressed
        {
         //--- deletion of all objects of the indicator
         func_all_delete();
        }
     }
  }
3.14. OnDeinit() 函数
最后,是 OnDeinit() 函数。这个函数启动函数来删除指标的所有图形对象。
//+------------------------------------------------------------------+
//| Custom indicator deinitialization function                       |
//+------------------------------------------------------------------+
void OnDeinit(const int reason)
  {
//--- delete all graphical objects of the indicator
   func_all_delete();
  }
Renko 图表是根据价格走势策略建立。
让我们从许多流行策略开始: 卖点在上行砖块开始下行,并且买点在相反情况。
如图例.5 所示:
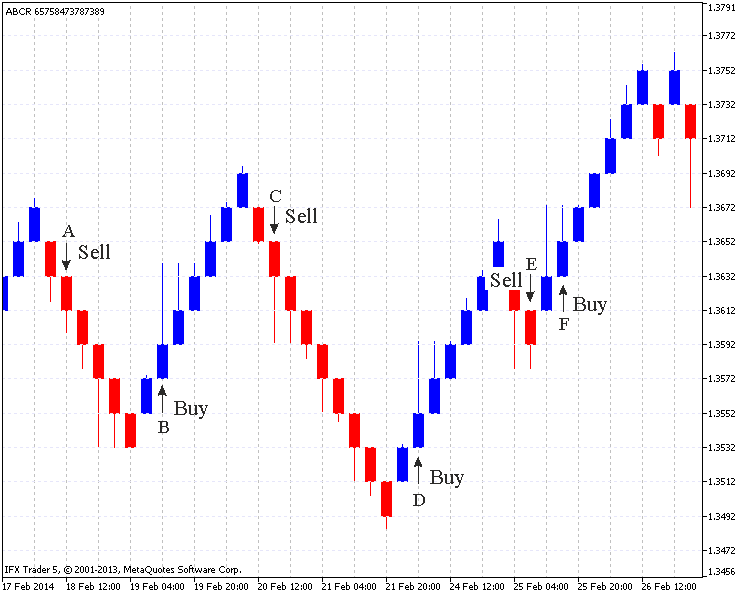
图例.5. 标准 Renko 图表 (EURUSD H4, 20 点)
图例. 5 显示了六个入场点 (A,B,C,D,E,F)。
在 "A" 点,上行砖块变为下行砖块。
反转砖块如 (B,C,D) 点同样依次创建。然而,在 "E" 点创建了两块一个方向的砖,而且向下的阴影创建在相同级别。
在这种情况下,入场可能在 "E" 和 "F" 点。这不是一个成功的入场位置, 因为价格移动到反向, 类似的情况是在 "F" 点: 其中一个走势同样创建了两块砖。上行阴影是在同一级别。然而,伴随强烈走势,价格不应该改变方向。
言外之意,最有利的入场点,是当一个反转砖块 (注意阴影) 按照同一走势创建。如果两块砖在同时被创建, 这个入场点也许是不安全的。
在图表上附加的 "ZigZag" 指标可以用来分析图形。图例. 6 显示一些例子: 这个 "支撑" 和 "阻力" 线, 这个 "头与肩膀" 模型设置。
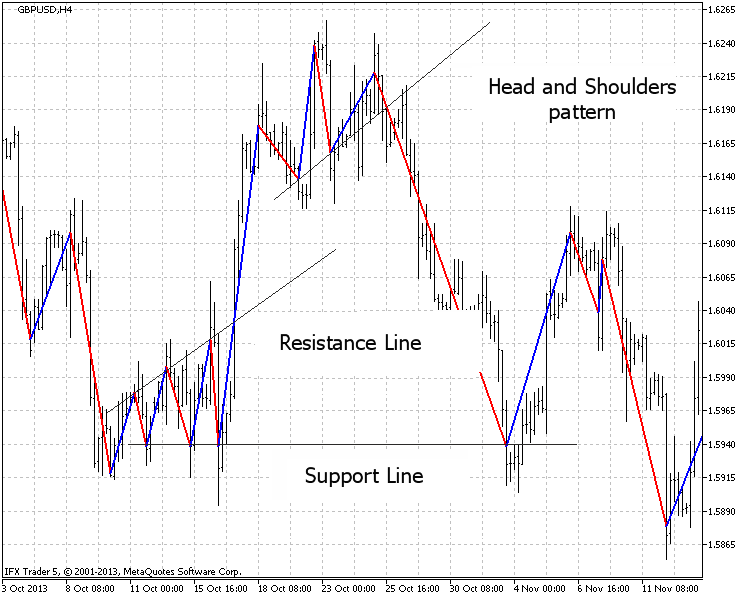
图例.6. 图形分析 (GBPUSD H4, 20 点)
该 "等距通道" 图形分析显示在图例. 7 中。
指标设为分析时间帧并且显示在四小时时间帧上。
如此设置可以让自定义跟随信号在一些时间帧并发, 亦即一个指标可以用在一个时间帧,而另一个用在第二个上。
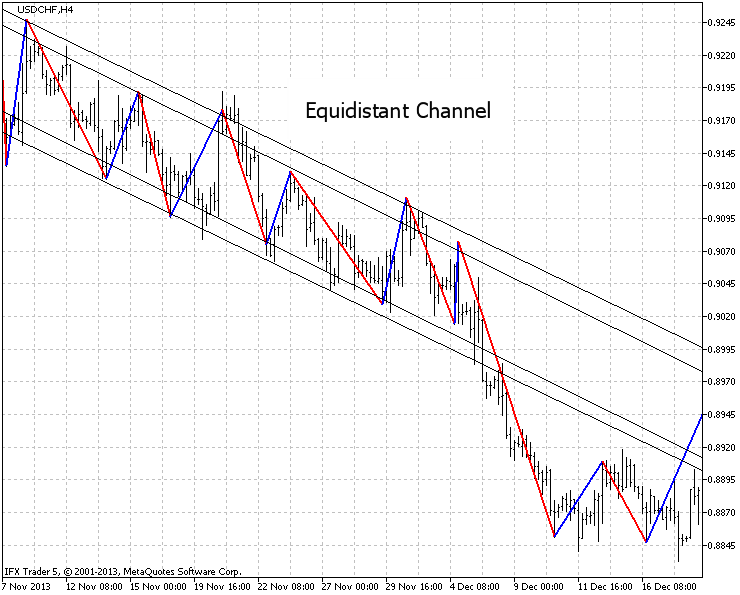
图例.7. 分析 "等距通道" USDCHF, H4, 设置在 H1, 20 点。
图例. 8 在一个图表上呈现不同时间帧的又一个例子。
时序图表显示了可能的最近反转,四小时图删除无用信号,日线图确认长期趋势走势。
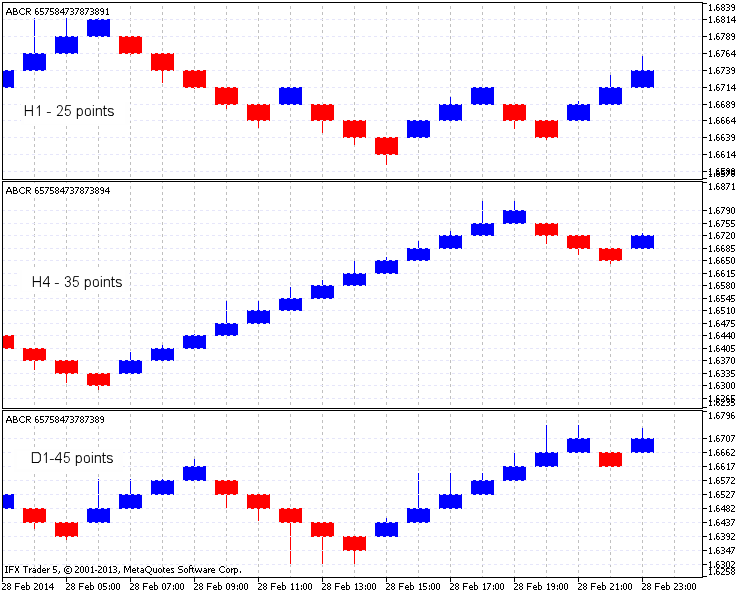
图例.8. 此 Renko 指标在 GBPUSD, H1, H4 和 D1
更多指标例子在图例. 9. 规则说: 在最接近的红砖之间建造上行线,与它们之间至少有一块蓝色的砖,并在创建低于线的砖之后卖出。
反之亦然: 在最接近的蓝砖之间建造下行线,与它们之间至少有一块红色的砖,并在创建高于线的砖之后买入。
提到的颜色则根据图例. 9。图例. 9. 蓝色和红色箭头标记画线的地方,大箭头标示卖和买的信号。
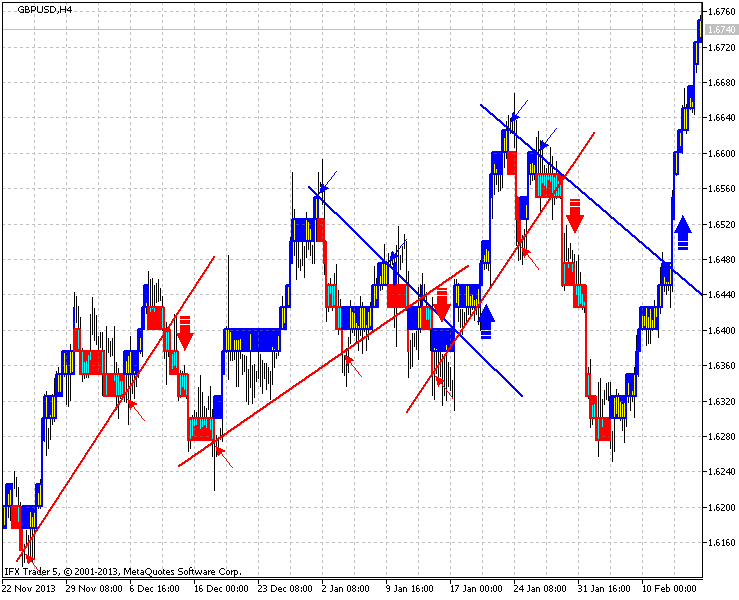
图例.9. 例子 GBPUSD, H4, 25 点 指标
此 Renko 图表对于初学者和职业交易员都很有趣。许多年过去,然而,它依旧在市场中使用。
在这篇文章中我想提请您注意这个图表,并改进 Renko 图表分析。我尝试展示 Renko 图表的详细构建方法。
我很高兴研究新的想法,以及改进这个指标,也许在将来实现它们。这里有一些指标实现的方式, 您同样可以找到您自己的实现方法。
感谢您的关注!我希望您的交易成功,并实现新的交易策略。

本社区仅针对特定人员开放
查看需注册登录并通过风险意识测评
5秒后跳转登录页面...
移动端课程
